Power BI Interface Tour
Learn the Power BI Desktop interface and key components
The Power BI Desktop Screen
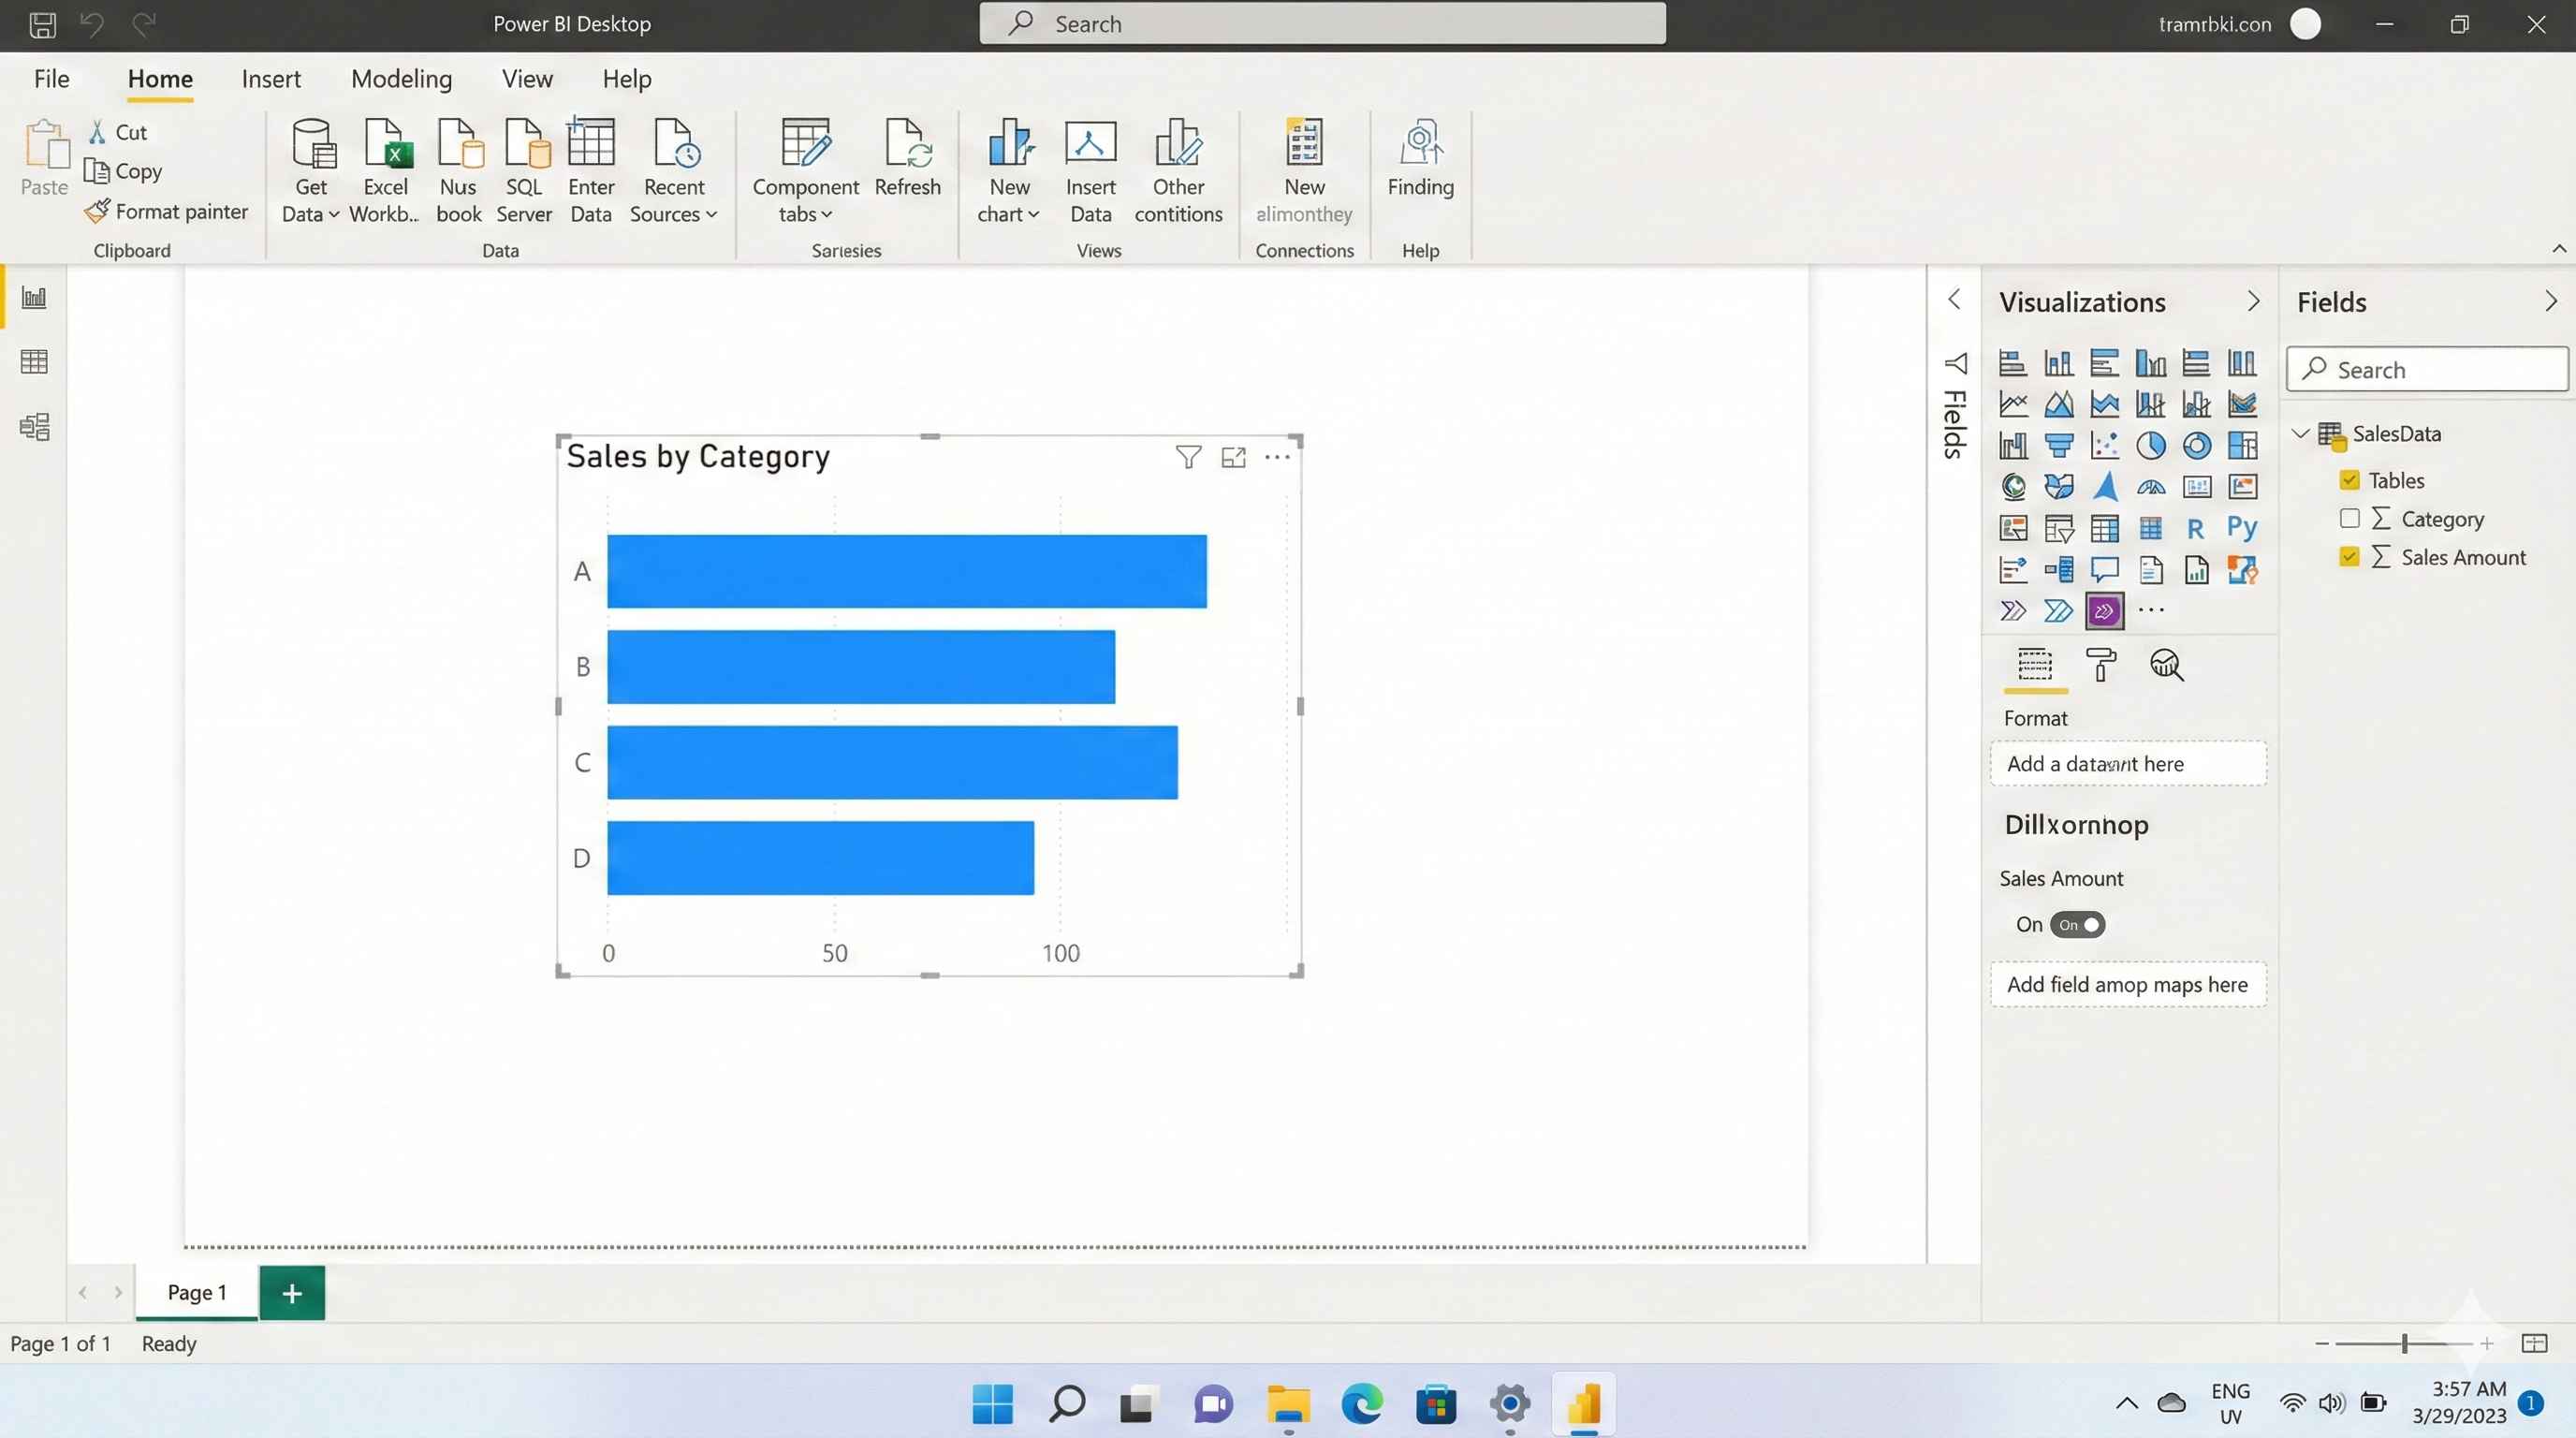
When you open Power BI, you'll see 5 main areas:
1. Ribbon (Top) The menu bar with all your tools - Get Data, Transform, Publish, etc.
2. Canvas (Center) Your workspace. This is where you drag and drop charts.
3. Visualizations Pane (Right) Pick your chart type here - bar charts, pie charts, tables, maps, and more.
4. Fields Pane (Far Right) Lists all your data tables and columns. Drag fields onto your charts.
5. Filters Pane Filter your data at visual, page, or report level.
Three Views
Click the icons on the left sidebar to switch views:
Report View - Build your dashboards (you'll use this most)
Data View - See your data in table format
Model View - See how your tables connect to each other
Quick Tips
- Add pages: Click + at the bottom
- Zoom: Use Ctrl + mouse wheel
- Align visuals: View > Snap to Grid
- Change look: View > Themes
Basic Workflow
- Get Data → Connect to your source
- Transform → Clean your data
- Model → Link your tables
- Report → Build visuals
- Publish → Share with team
Don't memorize the interface. Just start clicking around - you'll learn by doing.