Module 5
5 min read
Measures
Create powerful DAX measures for dynamic calculations
What are Measures?
Measures are dynamic calculations that respond to filters in real-time.
- Calculated on-the-fly (not stored)
- Automatically react to slicers and filters
- The heart of Power BI analytics
How to Create
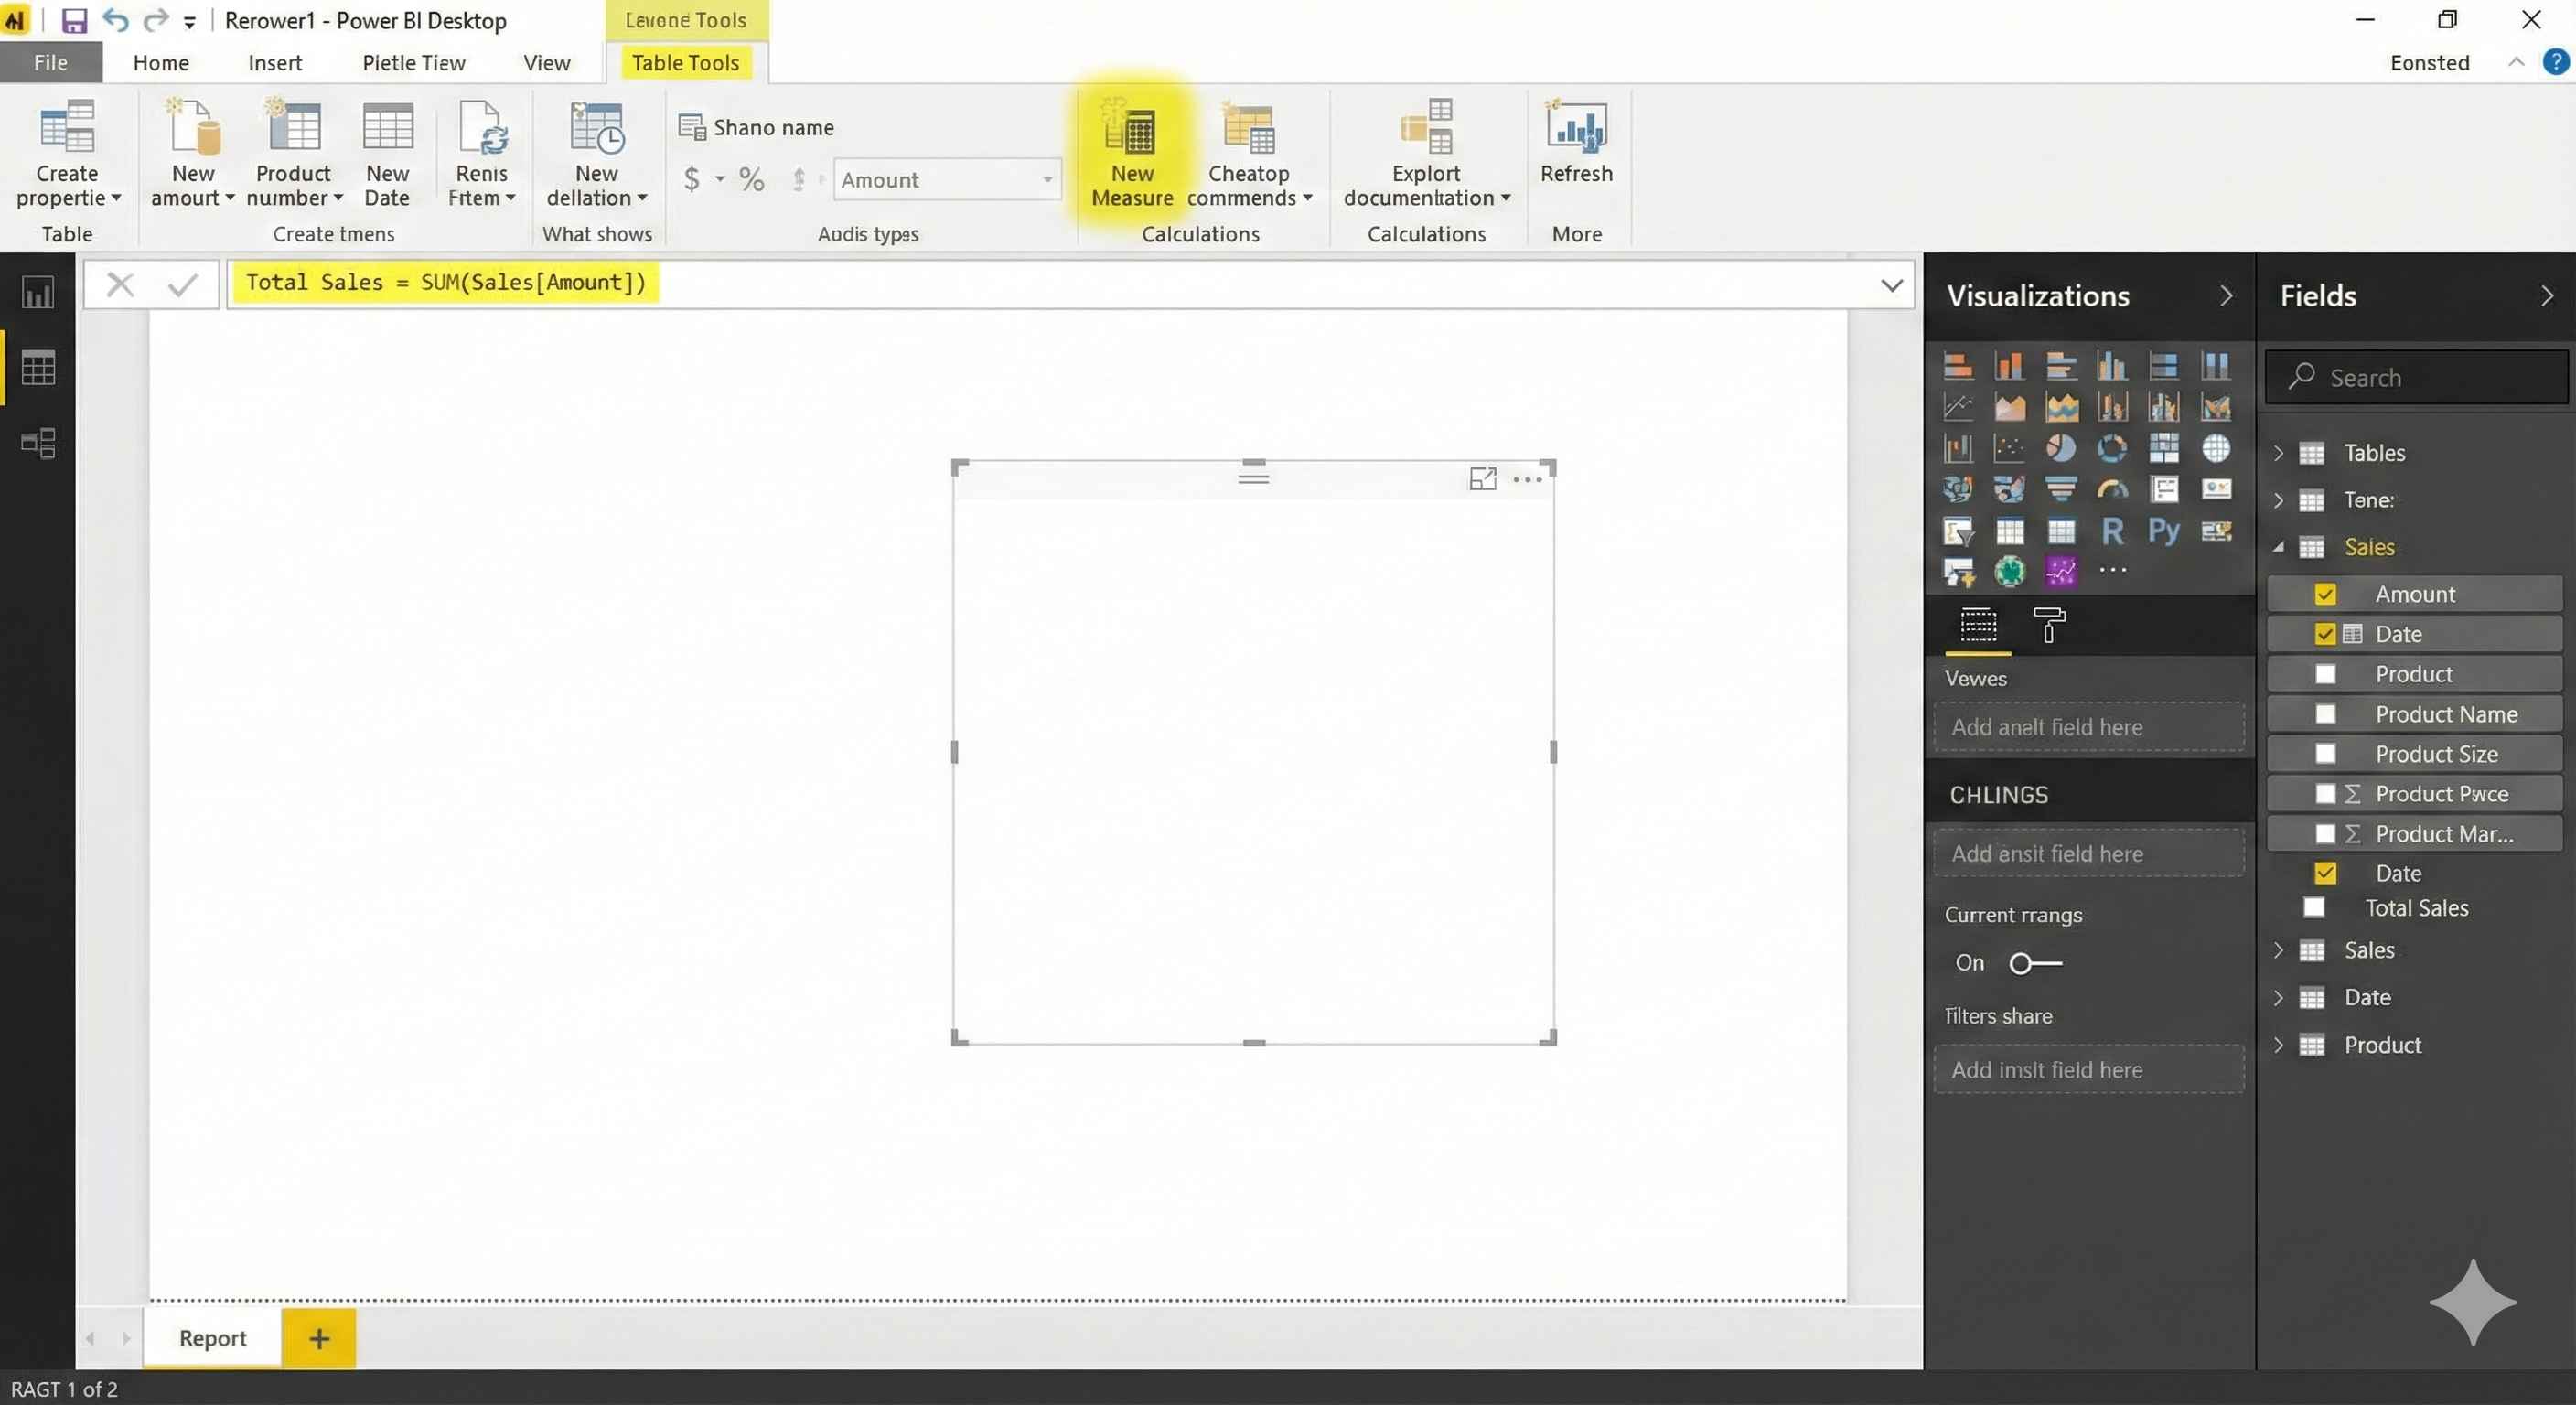
- Click table in Fields pane
- Table Tools > New Measure
- Type your formula
- Press Enter
Basic Aggregations
| Function | Example |
|---|---|
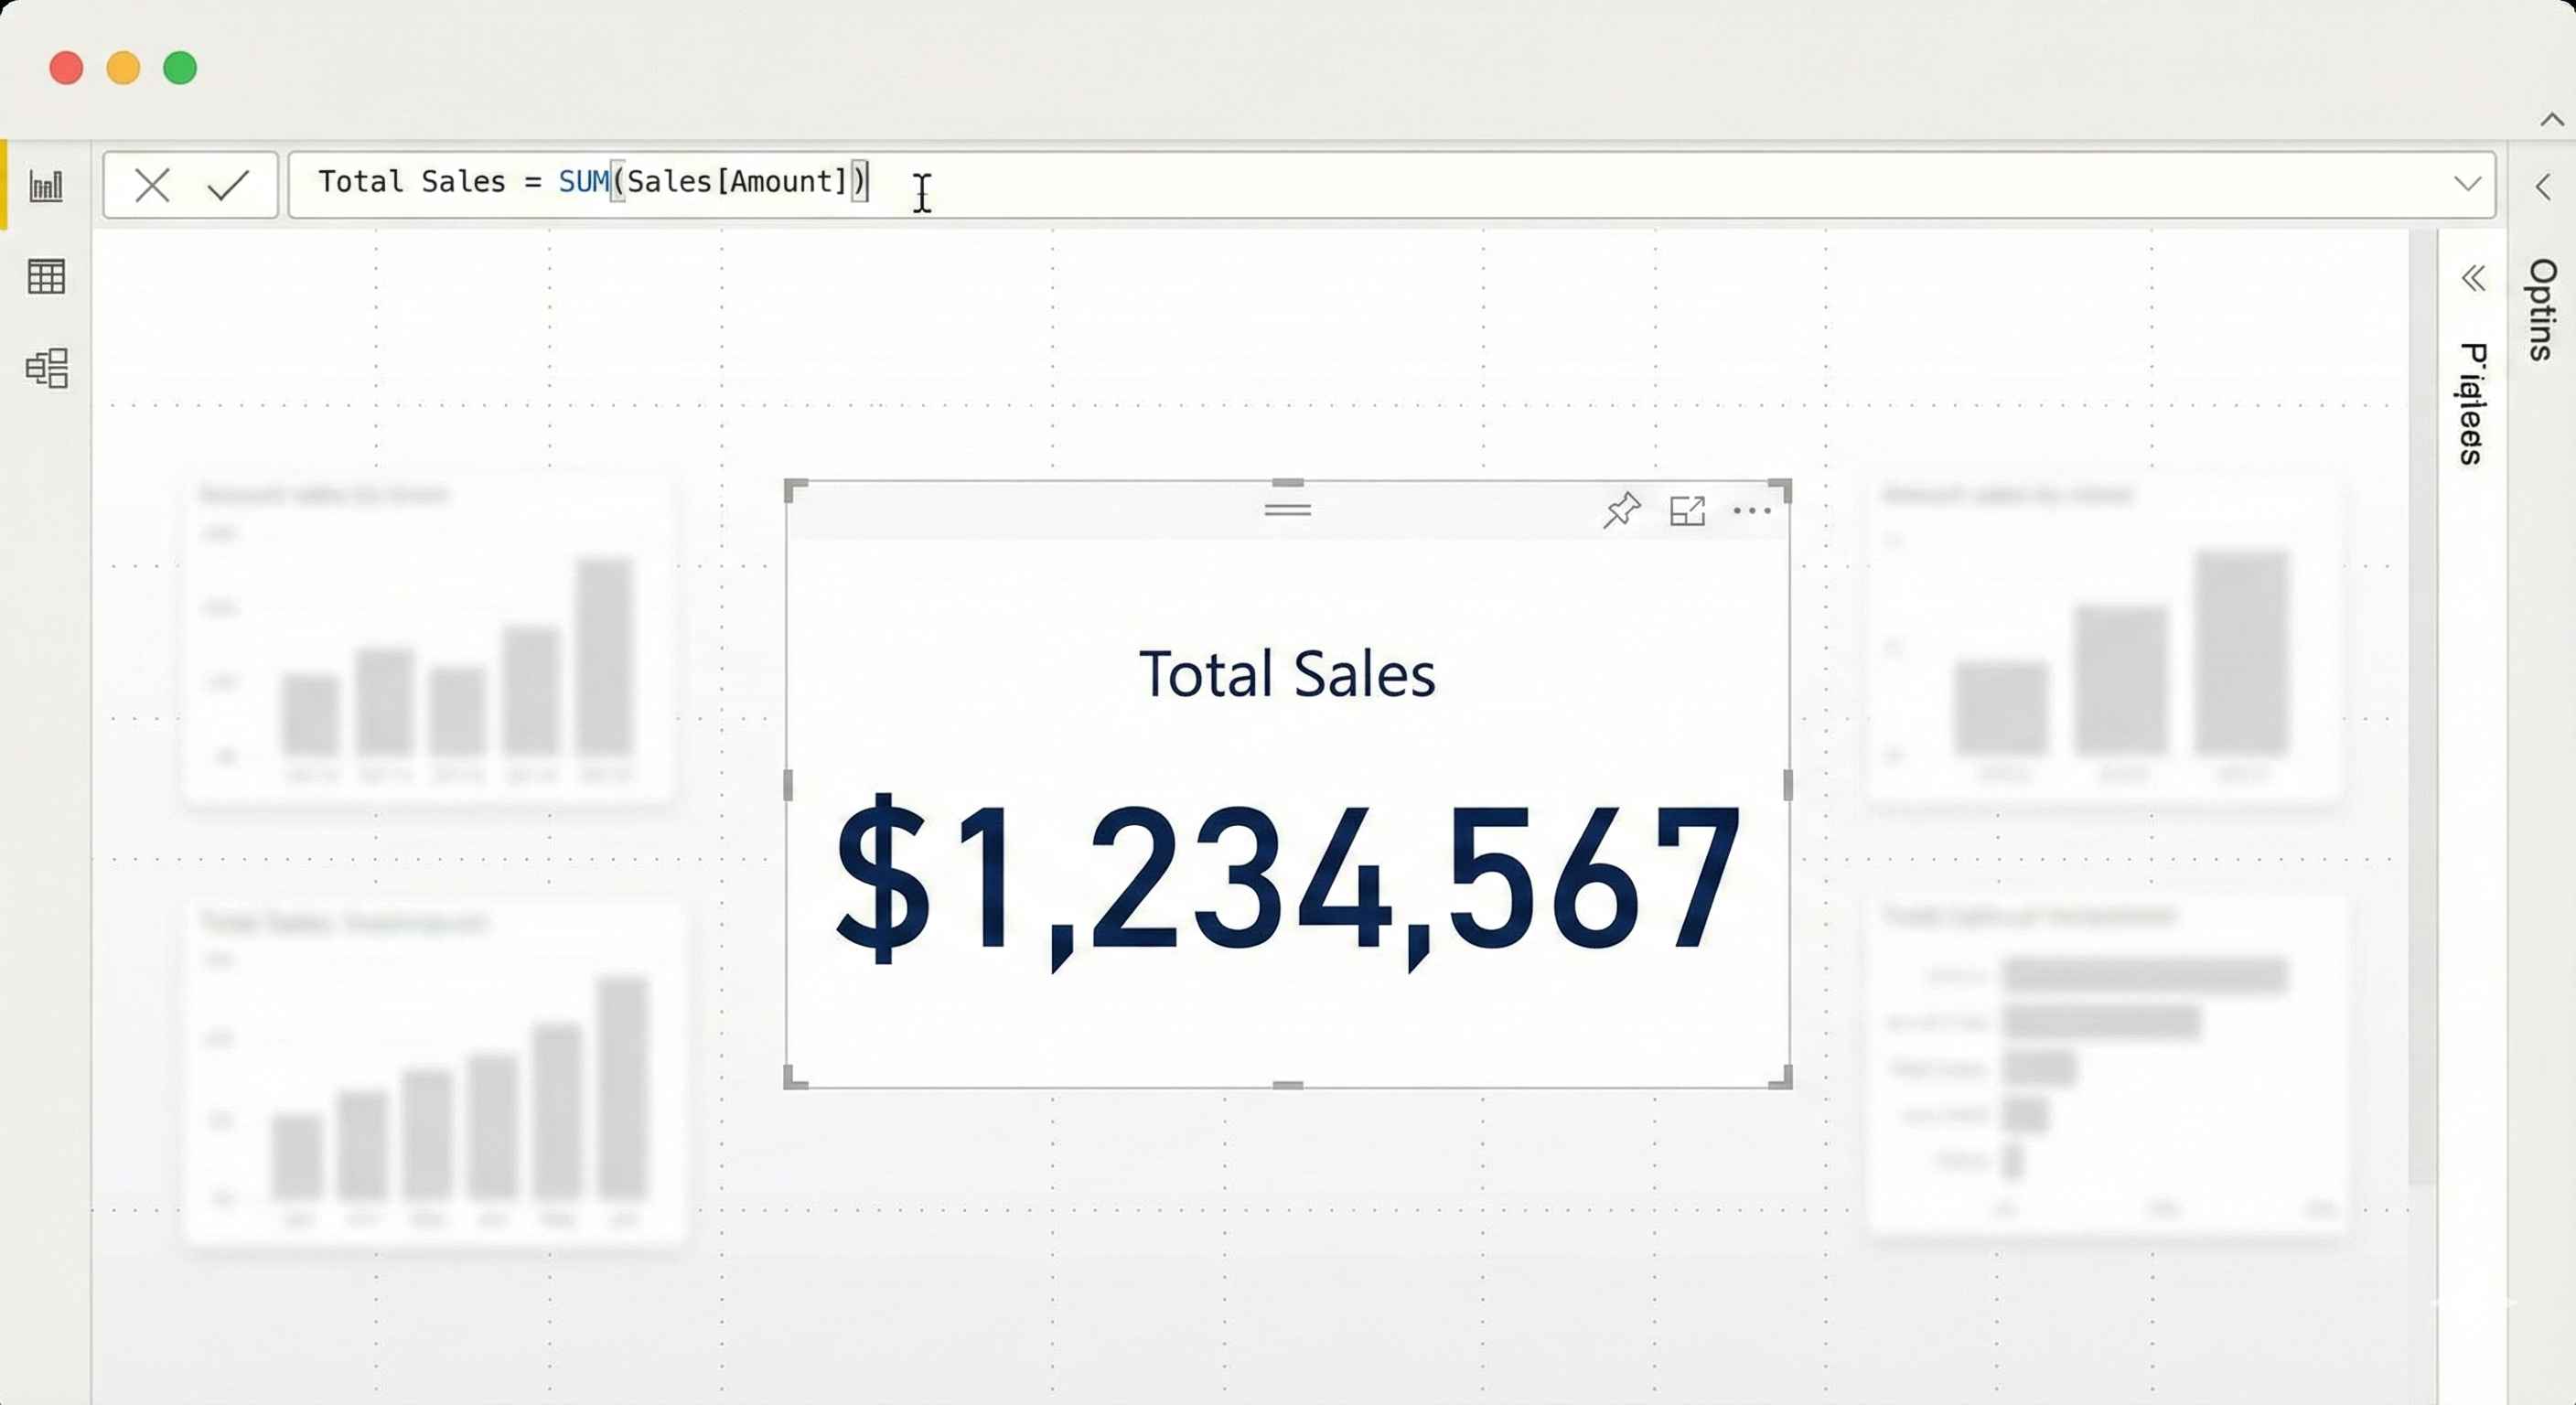
| SUM | Total Sales = SUM(Sales[Amount]) |
| AVERAGE | Avg Order = AVERAGE(Sales[Amount]) |
| COUNT | Orders = COUNT(Sales[OrderID]) |
| COUNTROWS | Total Rows = COUNTROWS(Sales) |
| DISTINCTCOUNT | Unique Customers = DISTINCTCOUNT(Sales[CustomerID]) |
Filter Context
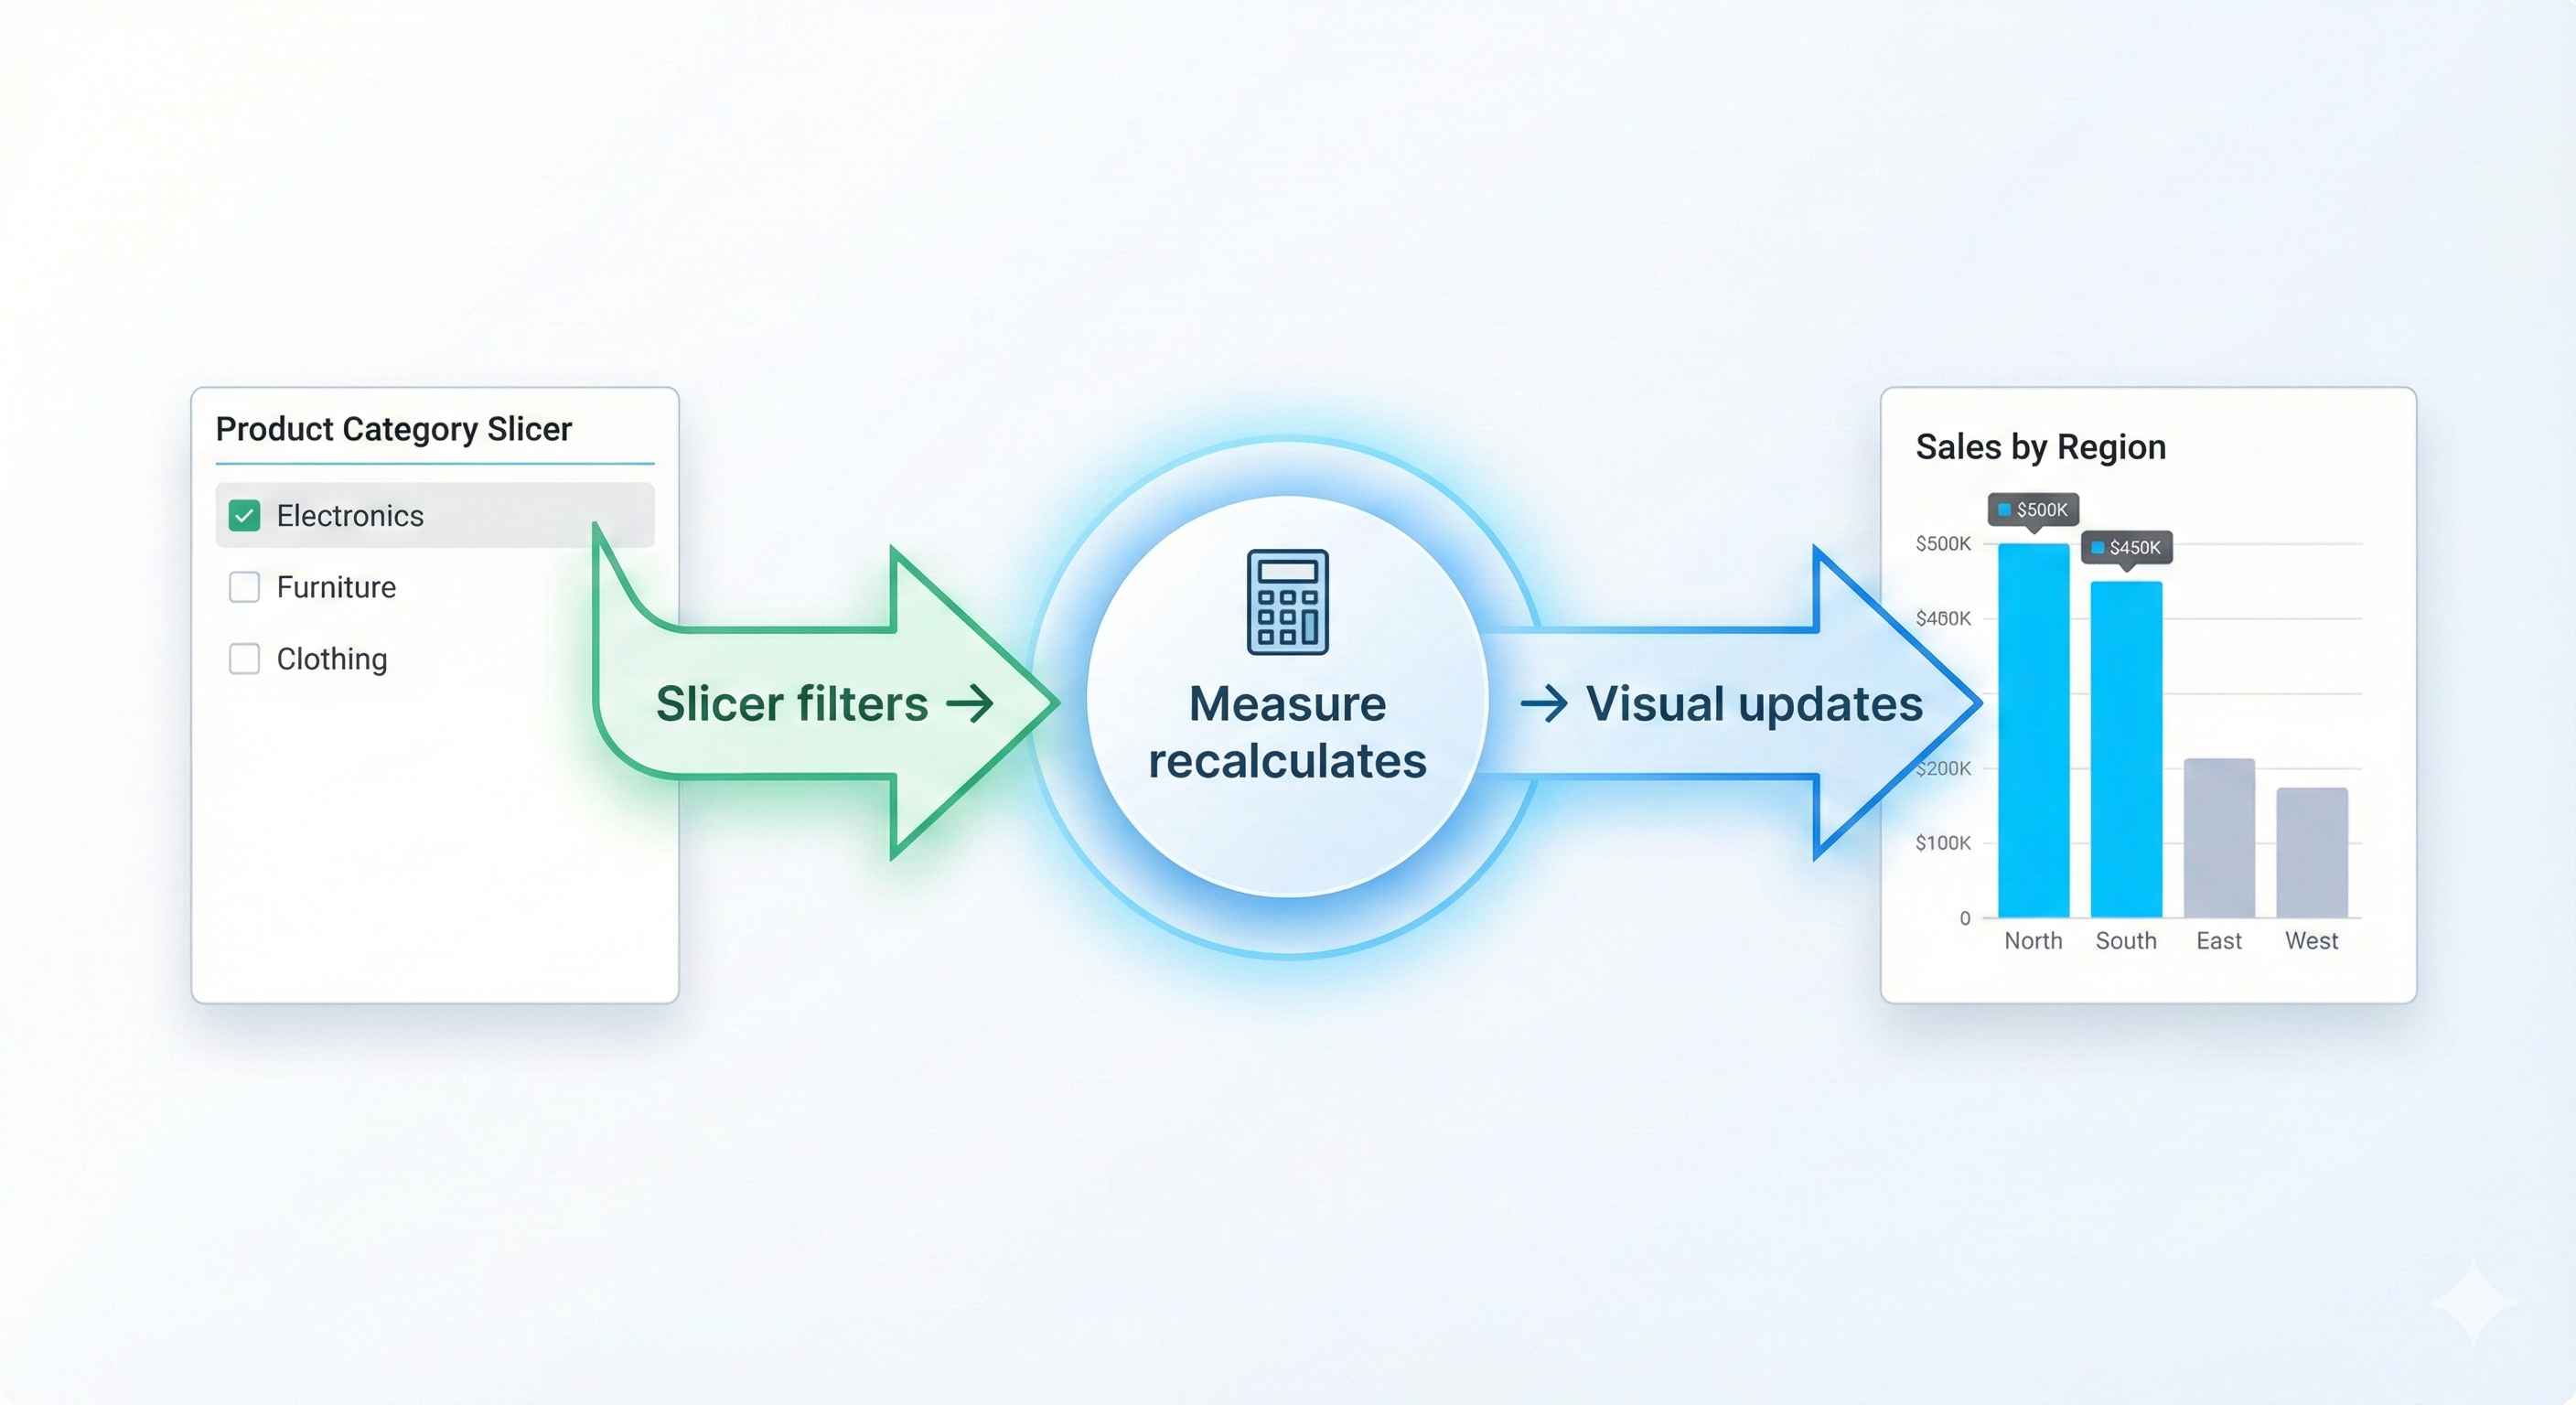
Measures change based on filters applied:
| Filter Applied | Result |
|---|---|
| None | Shows total for all data |
| Product slicer | Shows total for that product |
| Date filter | Shows total for that period |
This is what makes measures powerful!
CALCULATE Function
Most important DAX function - modifies filter context:
USA Sales = CALCULATE([Total Sales], Customers[Country] = "USA")
Remove all filters:
All Sales = CALCULATE([Total Sales], ALL(Sales))
Common Patterns
Percentage of Total
Sales % = DIVIDE(
    SUM(Sales[Amount]),
    CALCULATE(SUM(Sales[Amount]), ALL(Sales))
)
Safe Division
Margin = DIVIDE([Profit], [Revenue], 0)
Using Variables
Profit Margin =
VAR Revenue = SUM(Sales[Revenue])
VAR Cost = SUM(Sales[Cost])
RETURN DIVIDE(Revenue - Cost, Revenue)
Quick Tips
- Always use DIVIDE() instead of / operator
- Use VAR for complex formulas (cleaner + faster)
- Format measures: Right-click > Format
Measures are the real power of DAX. Master SUM, AVERAGE, COUNT, and CALCULATE first.