Measures of Spread
Learn range, variance, and standard deviation
Why Spread Matters?
Two datasets can have same mean but look completely different!
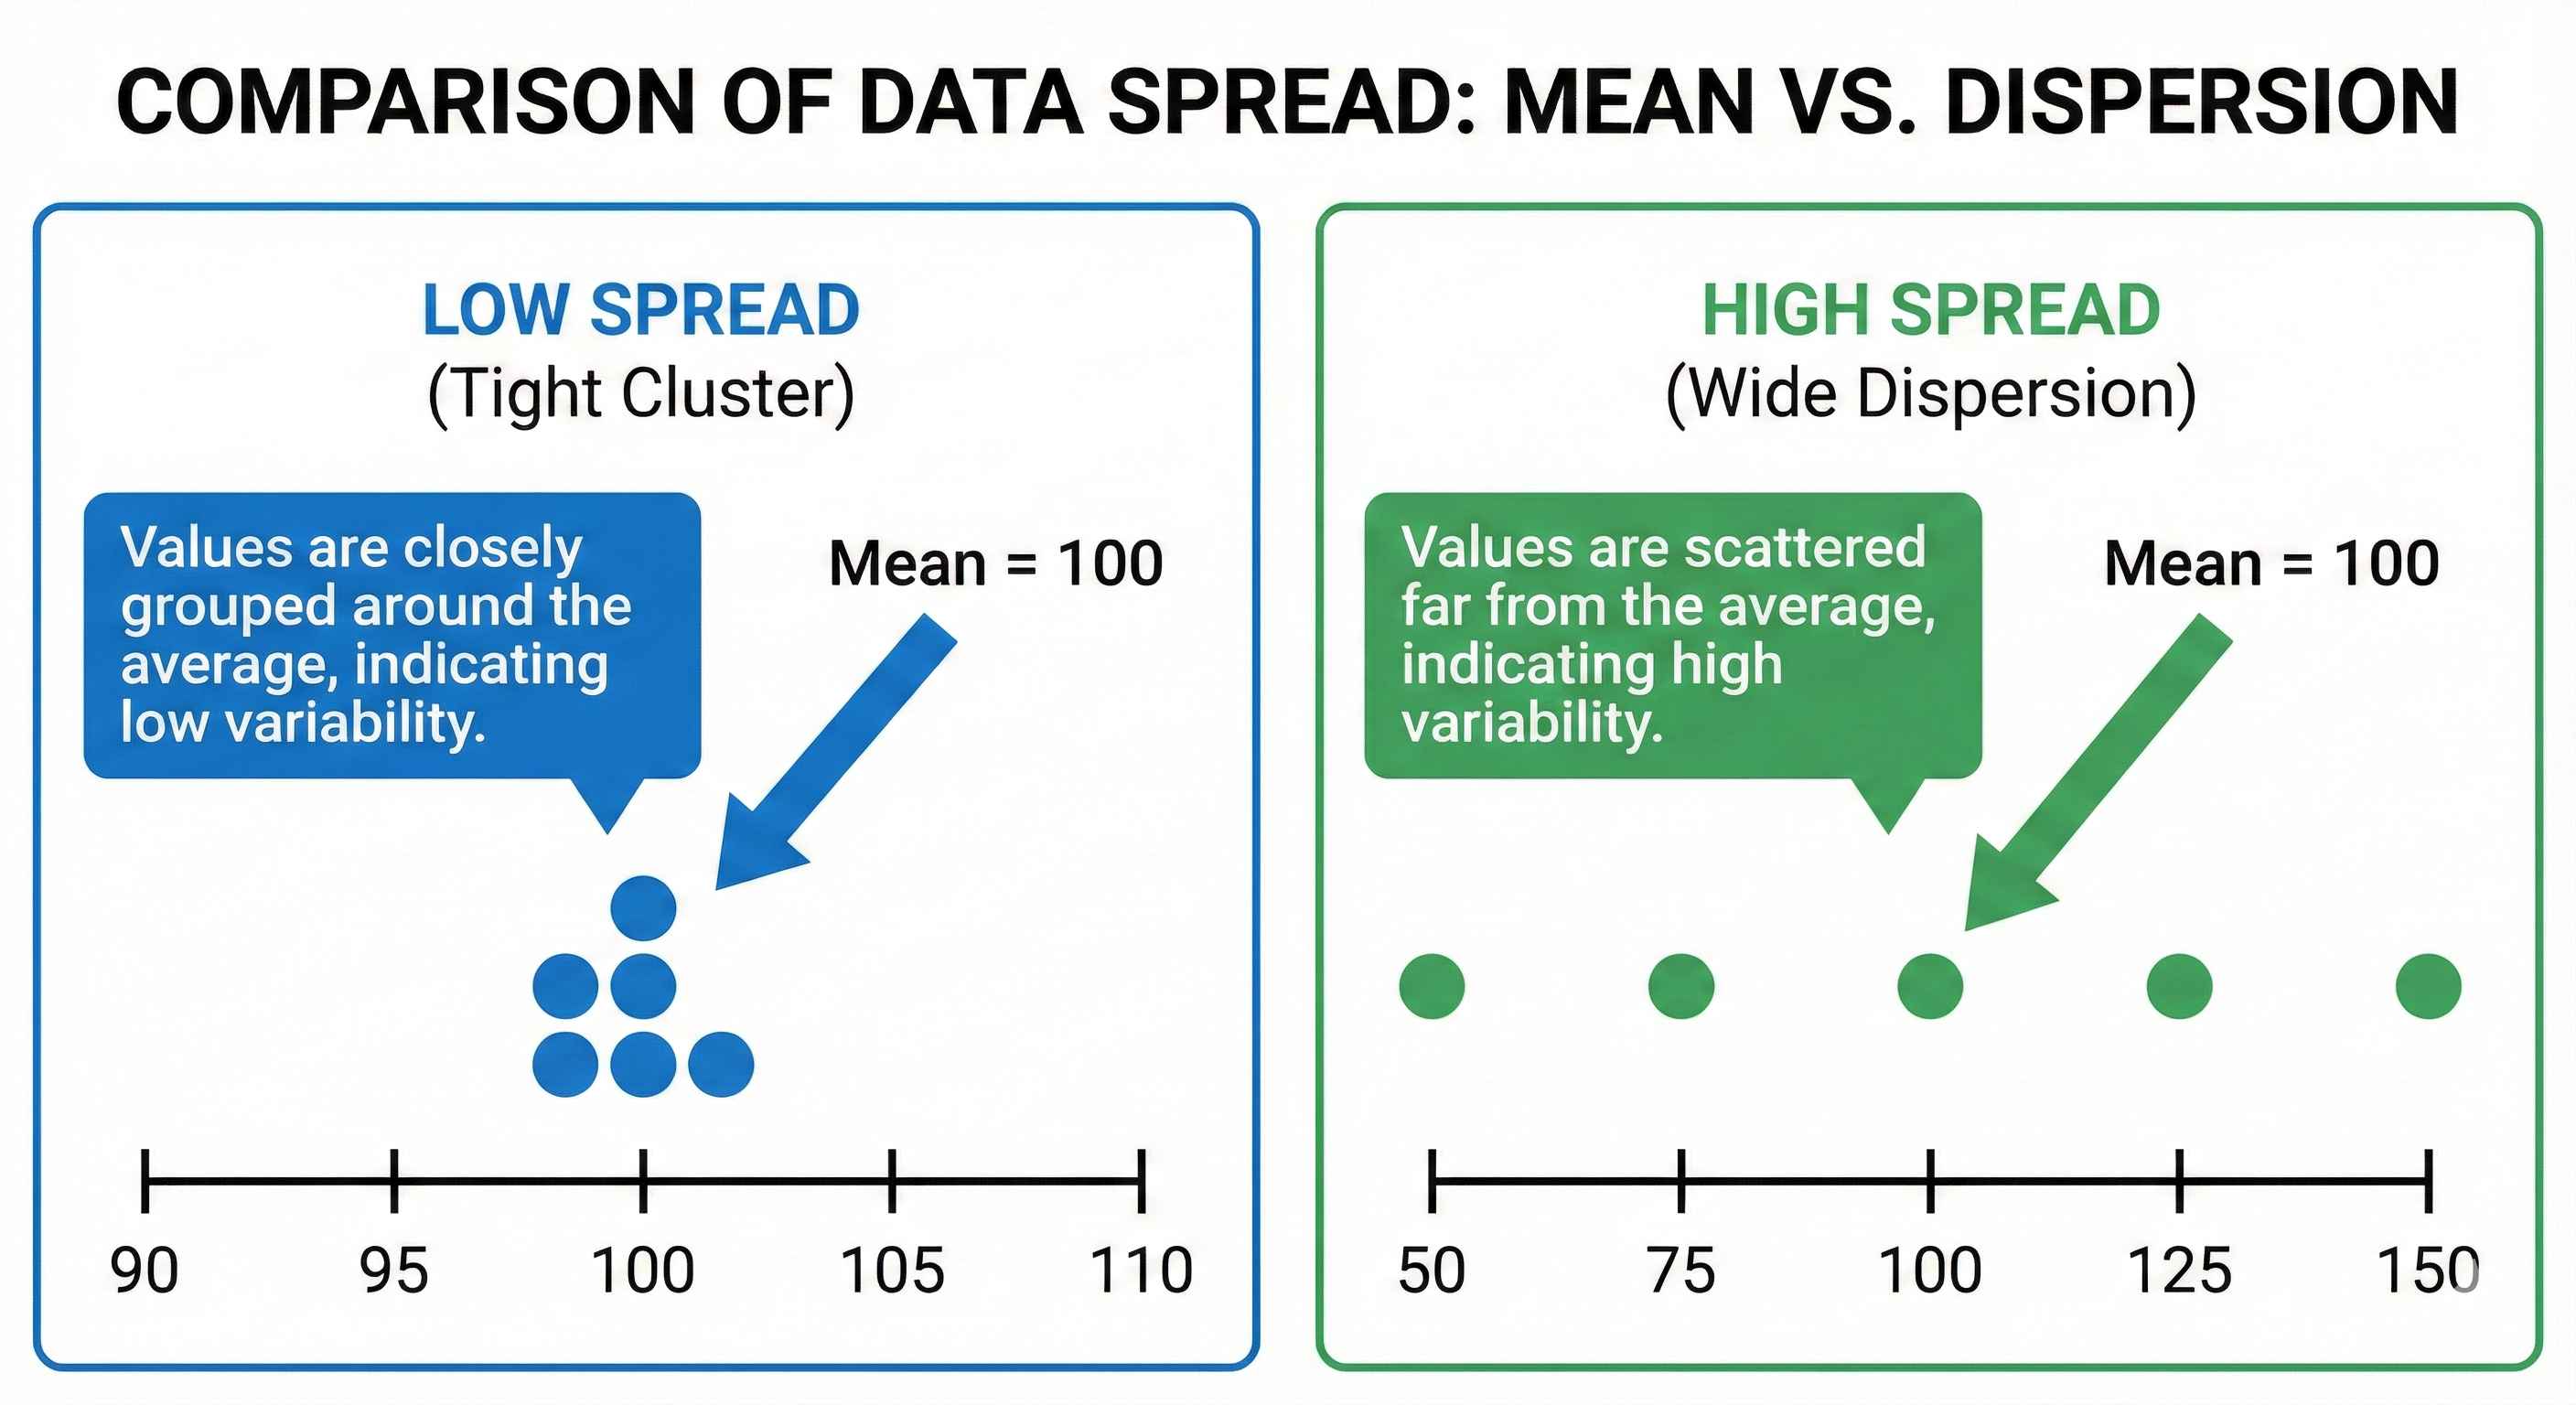
Dataset A: 98, 99, 100, 101, 102 → Mean = 100 (tight cluster) Dataset B: 50, 75, 100, 125, 150 → Mean = 100 (wide spread)
Spread tells you how scattered your data is.
1. Range (Simplest)
How: Maximum - Minimum
Example: Data: 10, 20, 30, 40, 50 Range = 50 - 10 = 40
Excel: =MAX(A1:A5) - MIN(A1:A5)
Python:
data = [10, 20, 30, 40, 50]
range_val = max(data) - min(data)
print(range_val)  # Output: 40
Limitation: One outlier can mess up range!
2. Standard Deviation (Most Used)
What it tells: How far values typically are from the mean
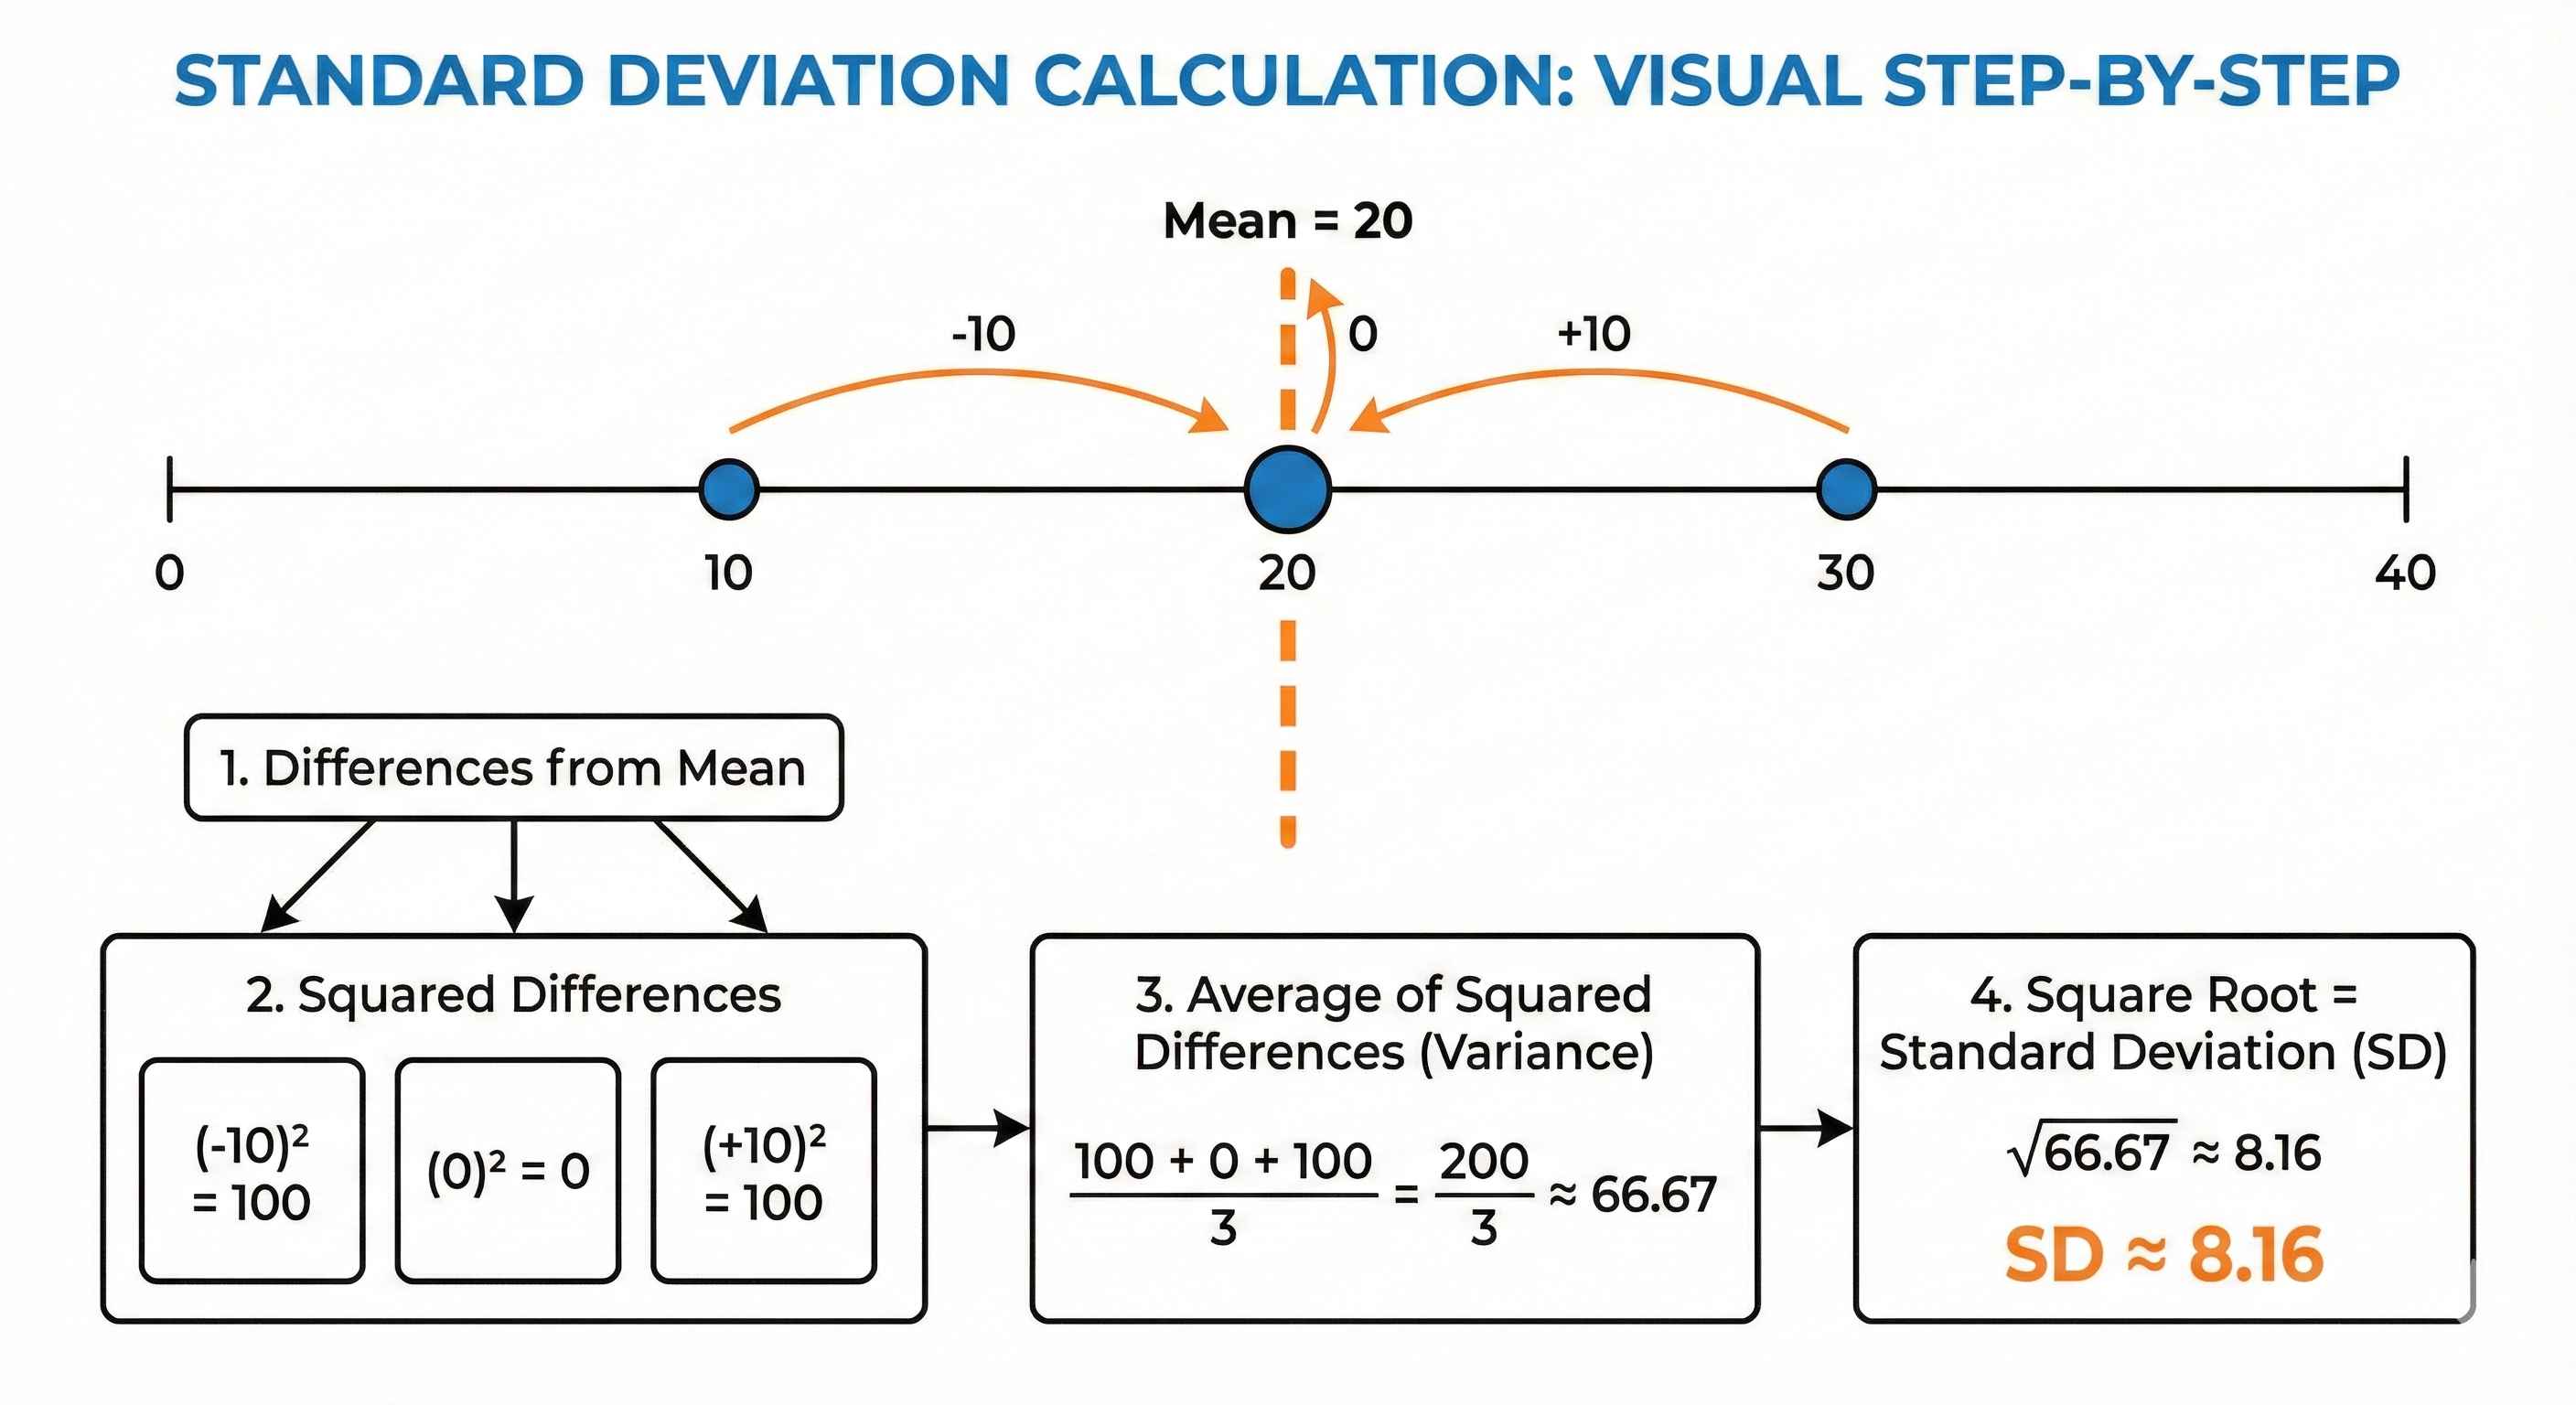
Example: Data: 10, 20, 30 (Mean = 20)
Step 1: Find differences from mean → -10, 0, +10 Step 2: Square them → 100, 0, 100 Step 3: Average → 200/3 = 66.67 (this is Variance) Step 4: Square root → √66.67 = 8.16 (this is SD)
Excel: =STDEV.S(A1:A3)
Python:
import statistics
data = [10, 20, 30]
sd = statistics.stdev(data)
print(sd)  # Output: 10.0
3. Interpreting Standard Deviation
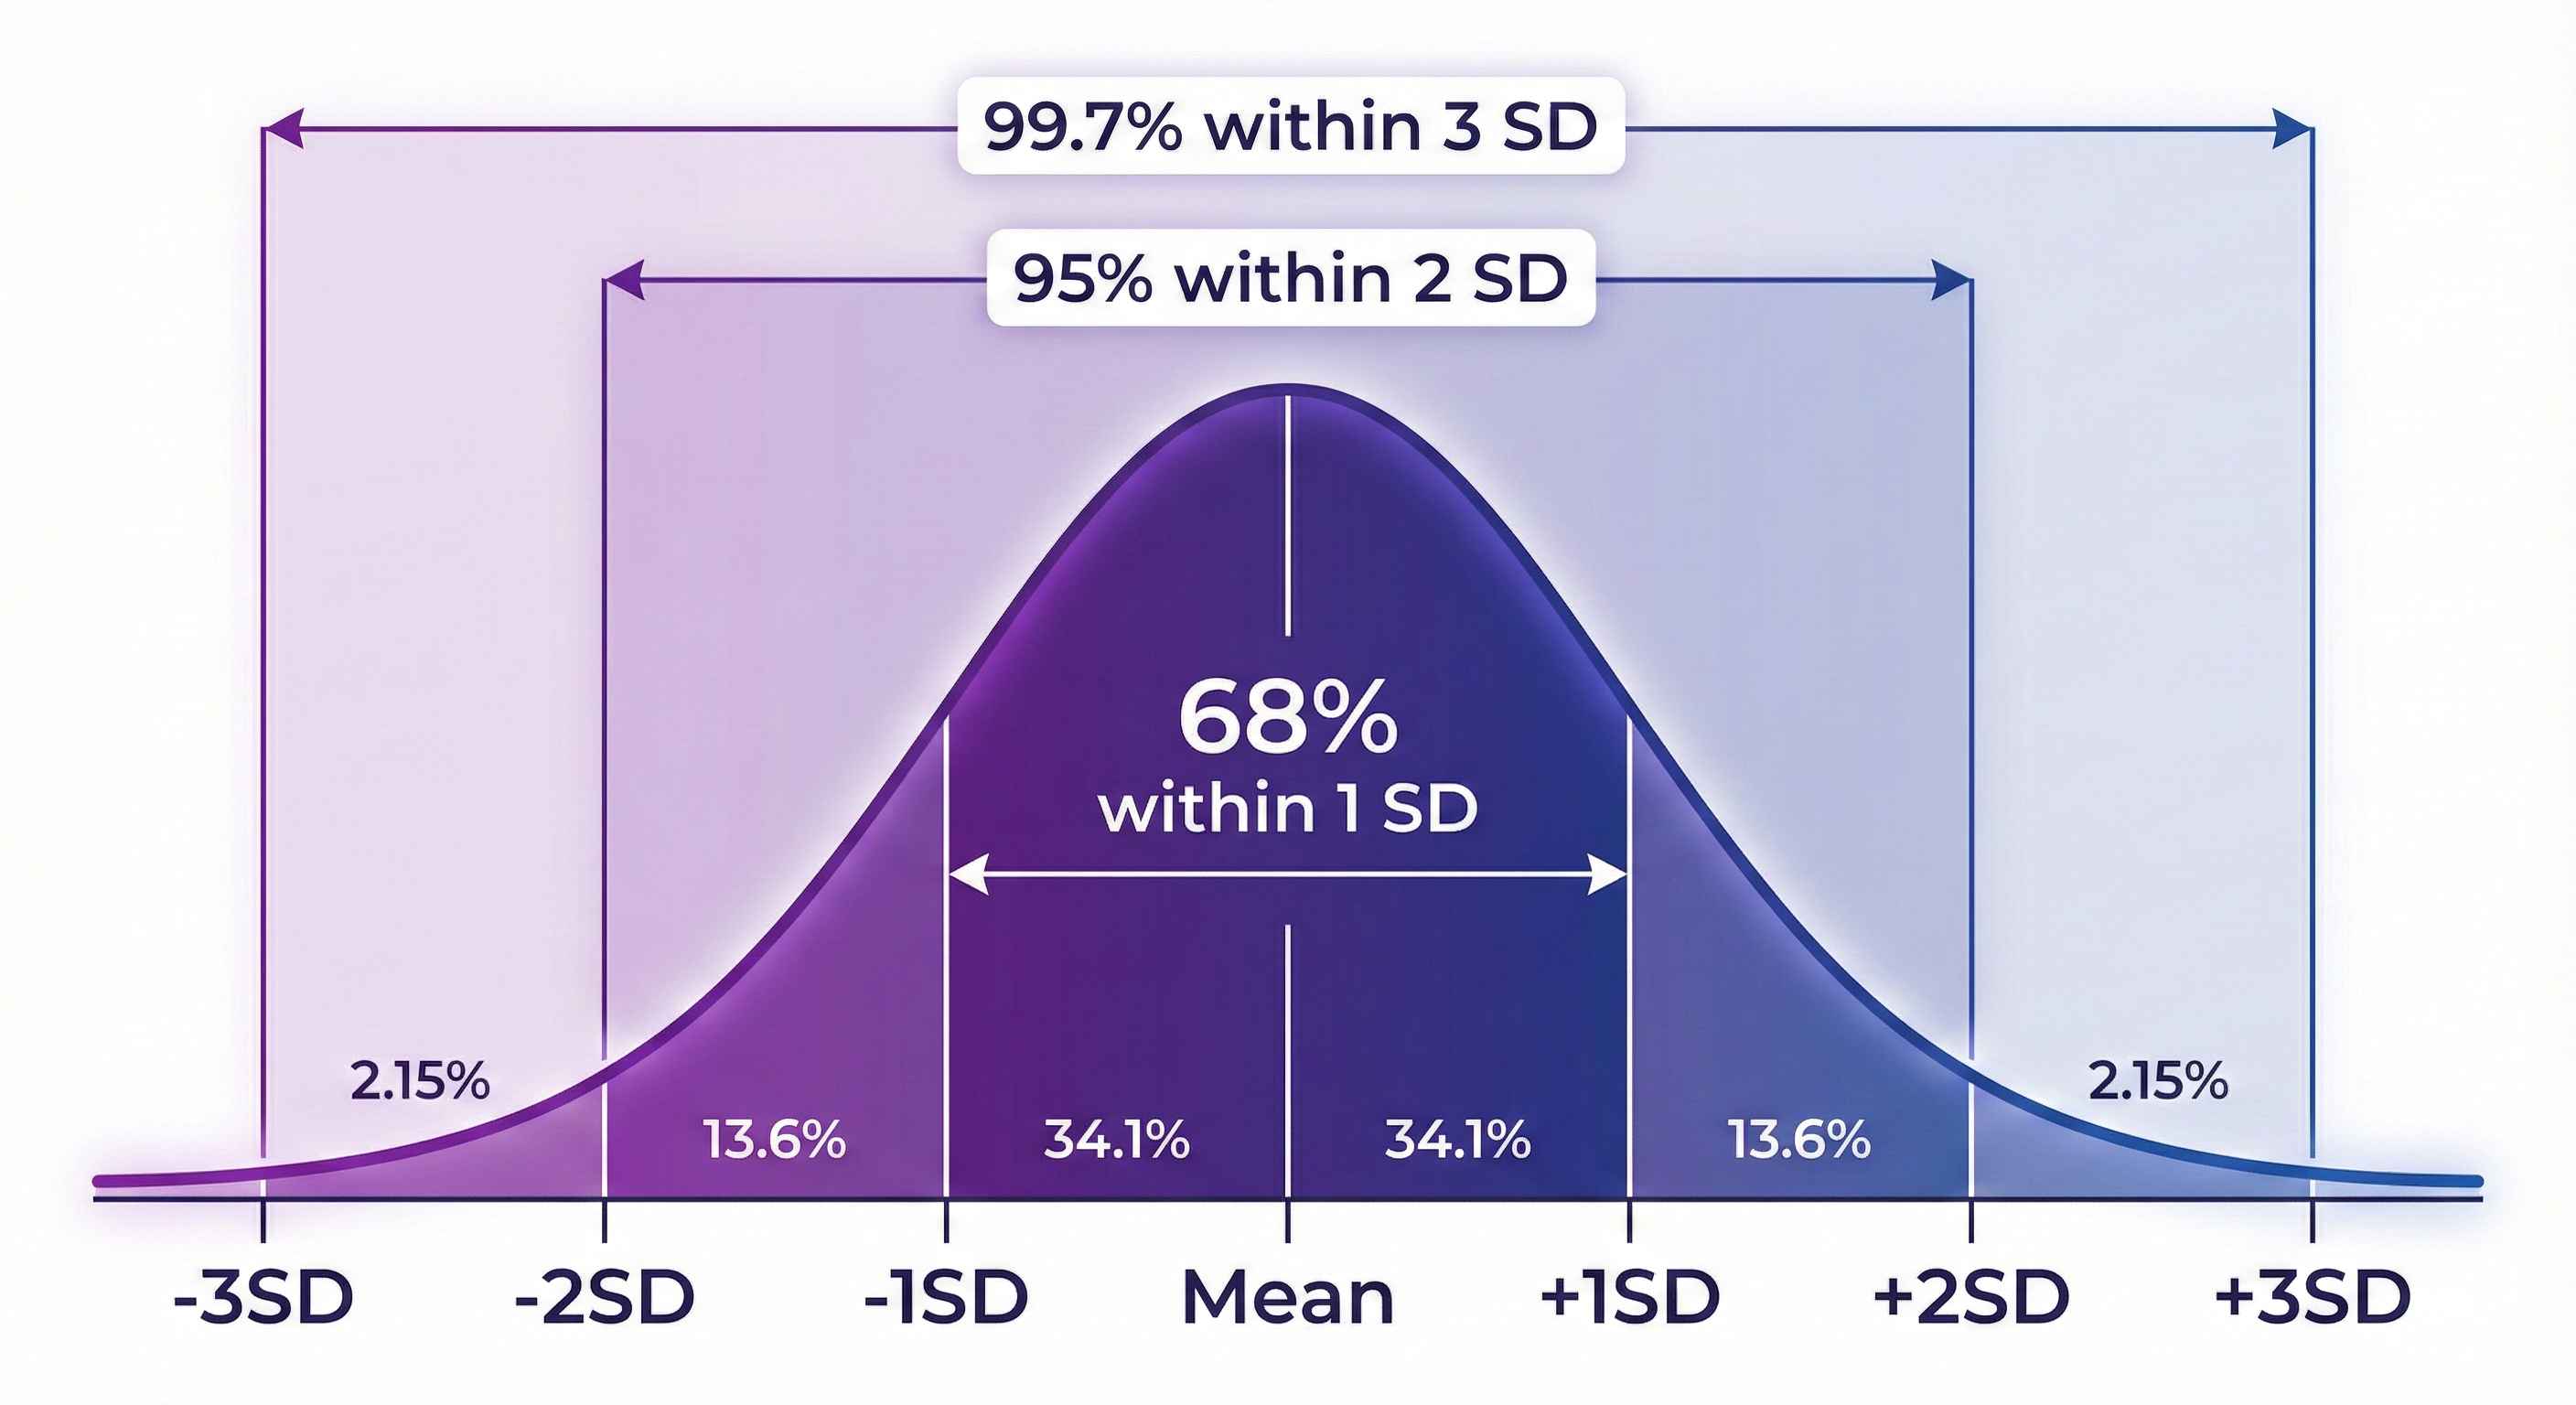
For normal data:
- 68% of data falls within 1 SD of mean
- 95% of data falls within 2 SD of mean
- 99.7% of data falls within 3 SD of mean
Example: If mean = 100, SD = 15
- 68% of values are between 85-115
- 95% of values are between 70-130
Quick Comparison
| Measure | Formula | Best For |
|---|---|---|
| Range | Max - Min | Quick overview |
| Standard Deviation | √Variance | Most analysis |
| Variance | Avg of squared differences | Statistical calculations |
Cheat Sheet
| Measure | Excel | Python |
|---|---|---|
| Range | =MAX()-MIN() | max(data)-min(data) |
| Variance | =VAR.S() | statistics.variance() |
| Std Dev | =STDEV.S() | statistics.stdev() |
Quick Practice
Data: 5, 10, 15, 20, 25 (Mean = 15)
- Range = 25 - 5 = 20
- SD = 7.9
Tip: Low SD = data points are close to mean. High SD = data is spread out!