Module 1
5 min read
Percentiles & Quartiles
Learn to divide data into meaningful parts
What Are Percentiles?
Percentile = Value below which X% of data falls
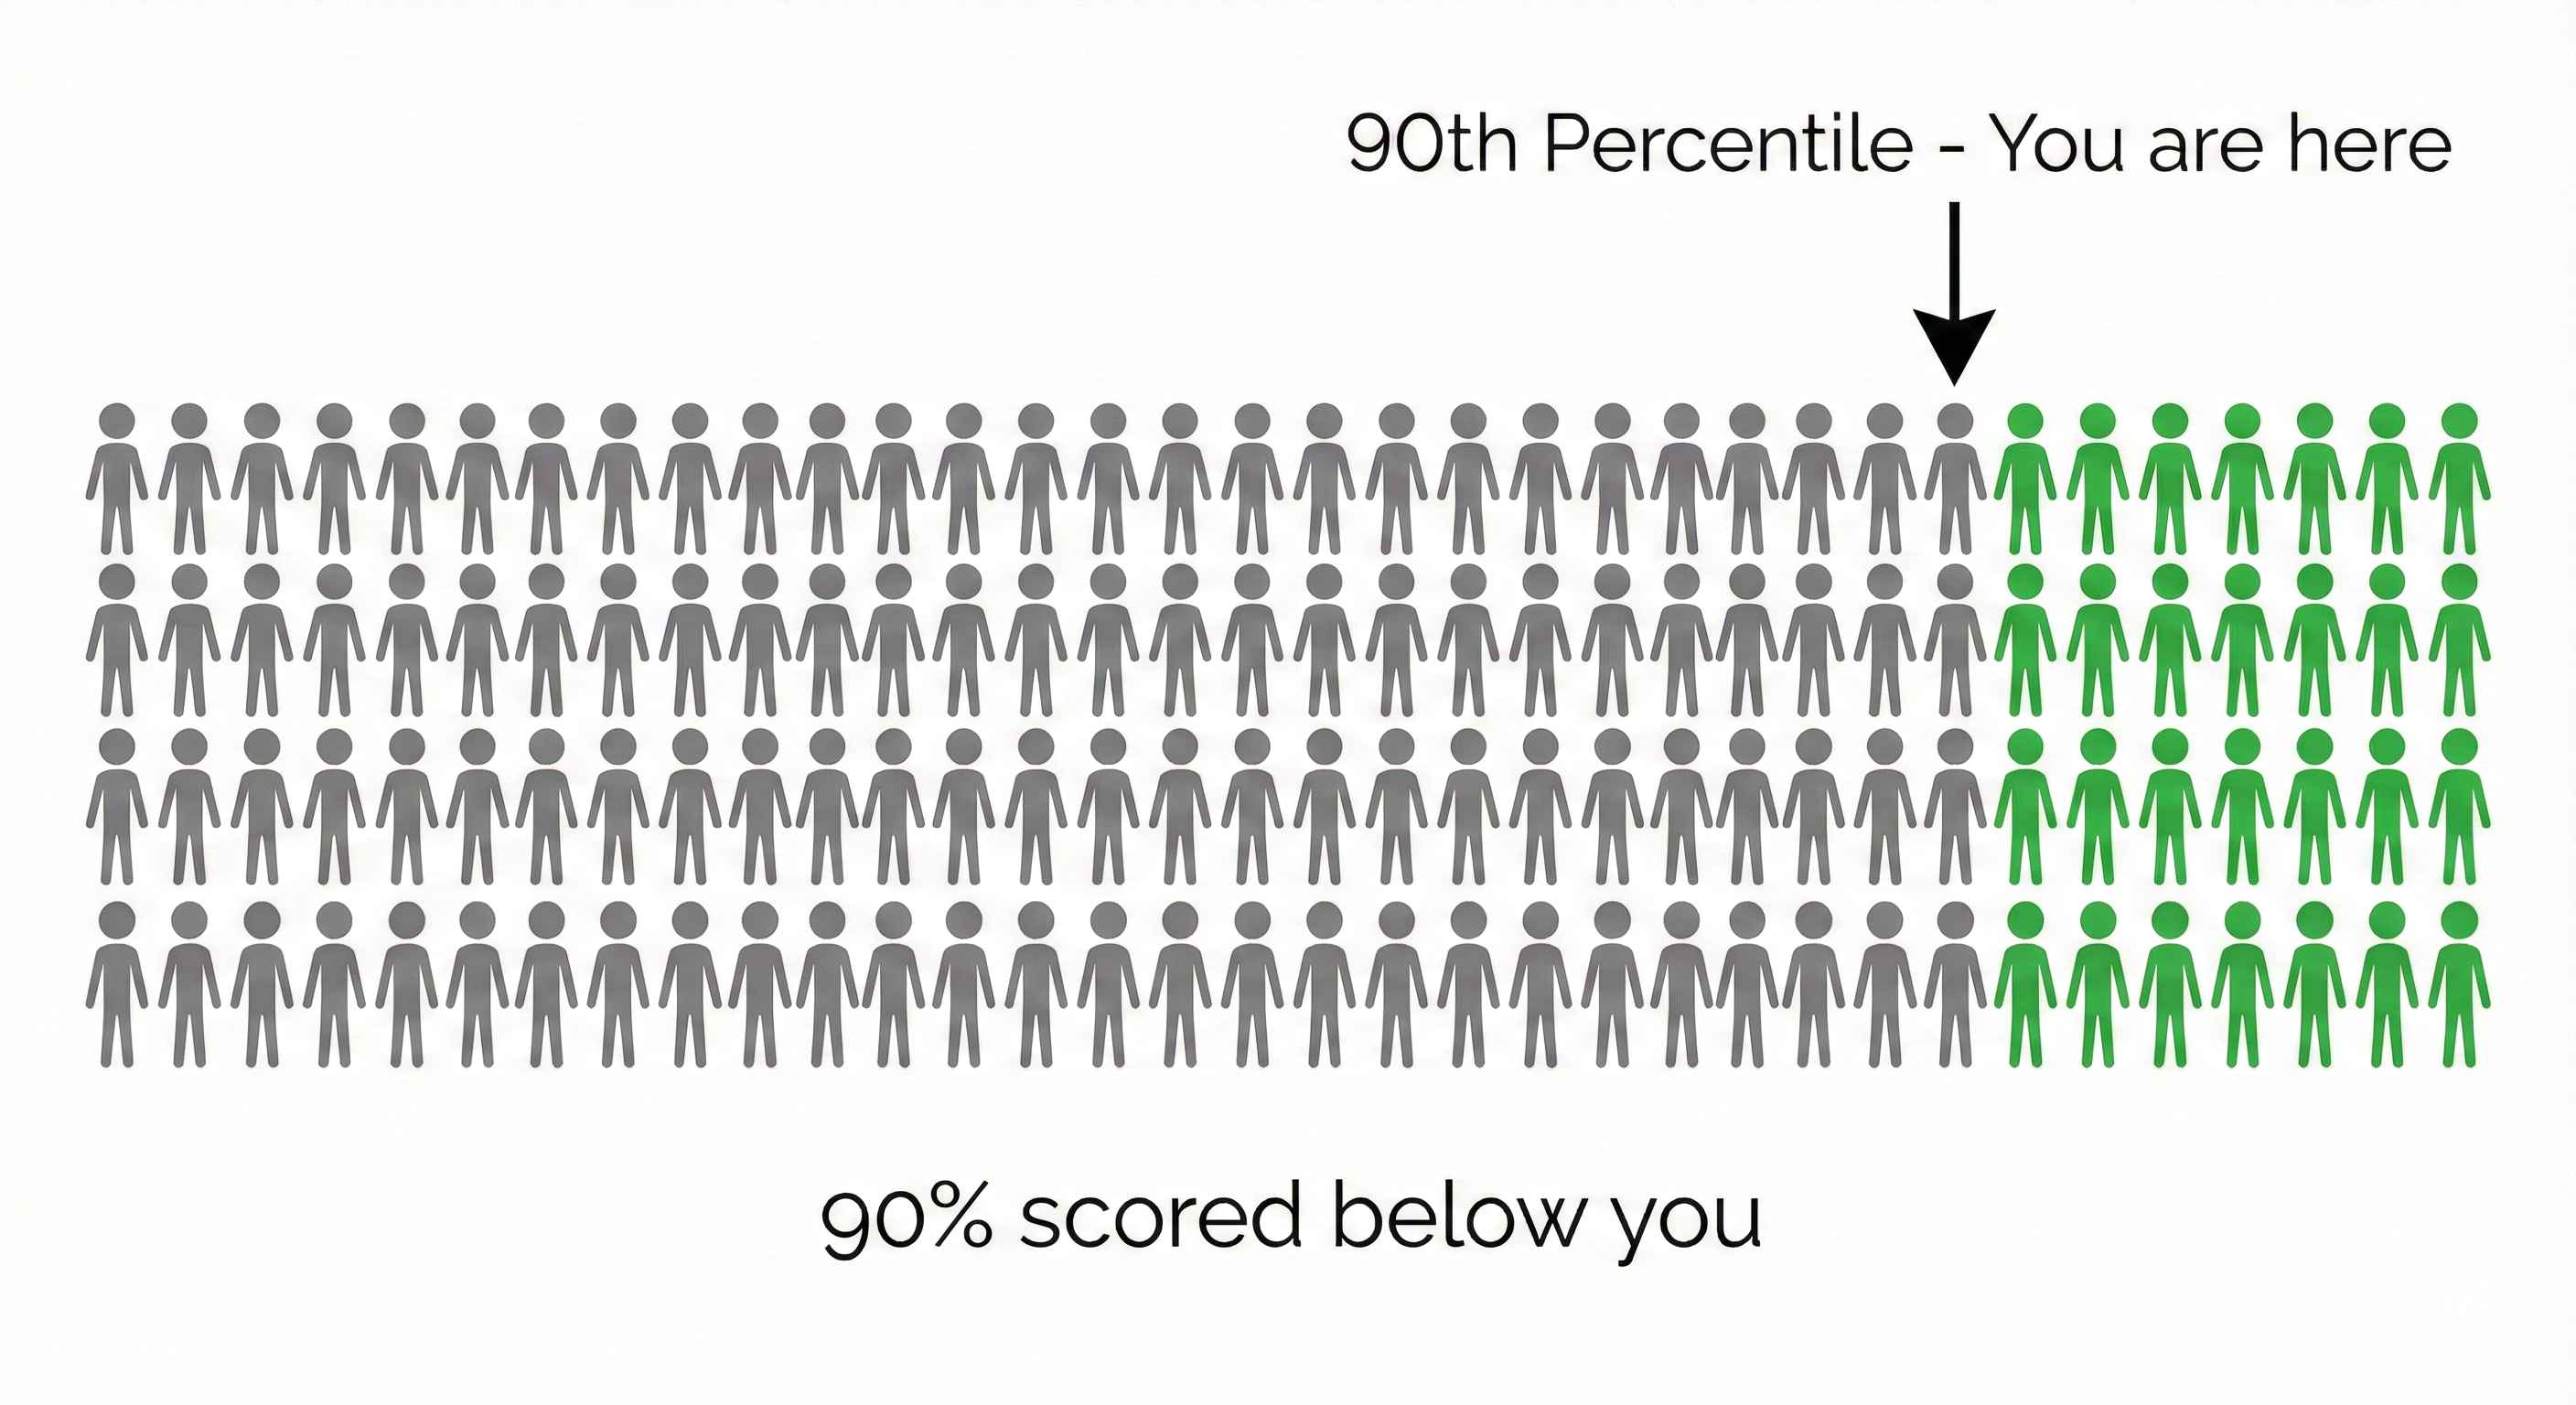
Example: If you scored in the 90th percentile on a test:
- 90% of students scored below you
- Only 10% scored above you
Real-world uses:
- Test scores: "Top 15% of students"
- Salaries: "You earn more than 70% of people"
- Website speed: "Page loads in 2s for 95% of users"
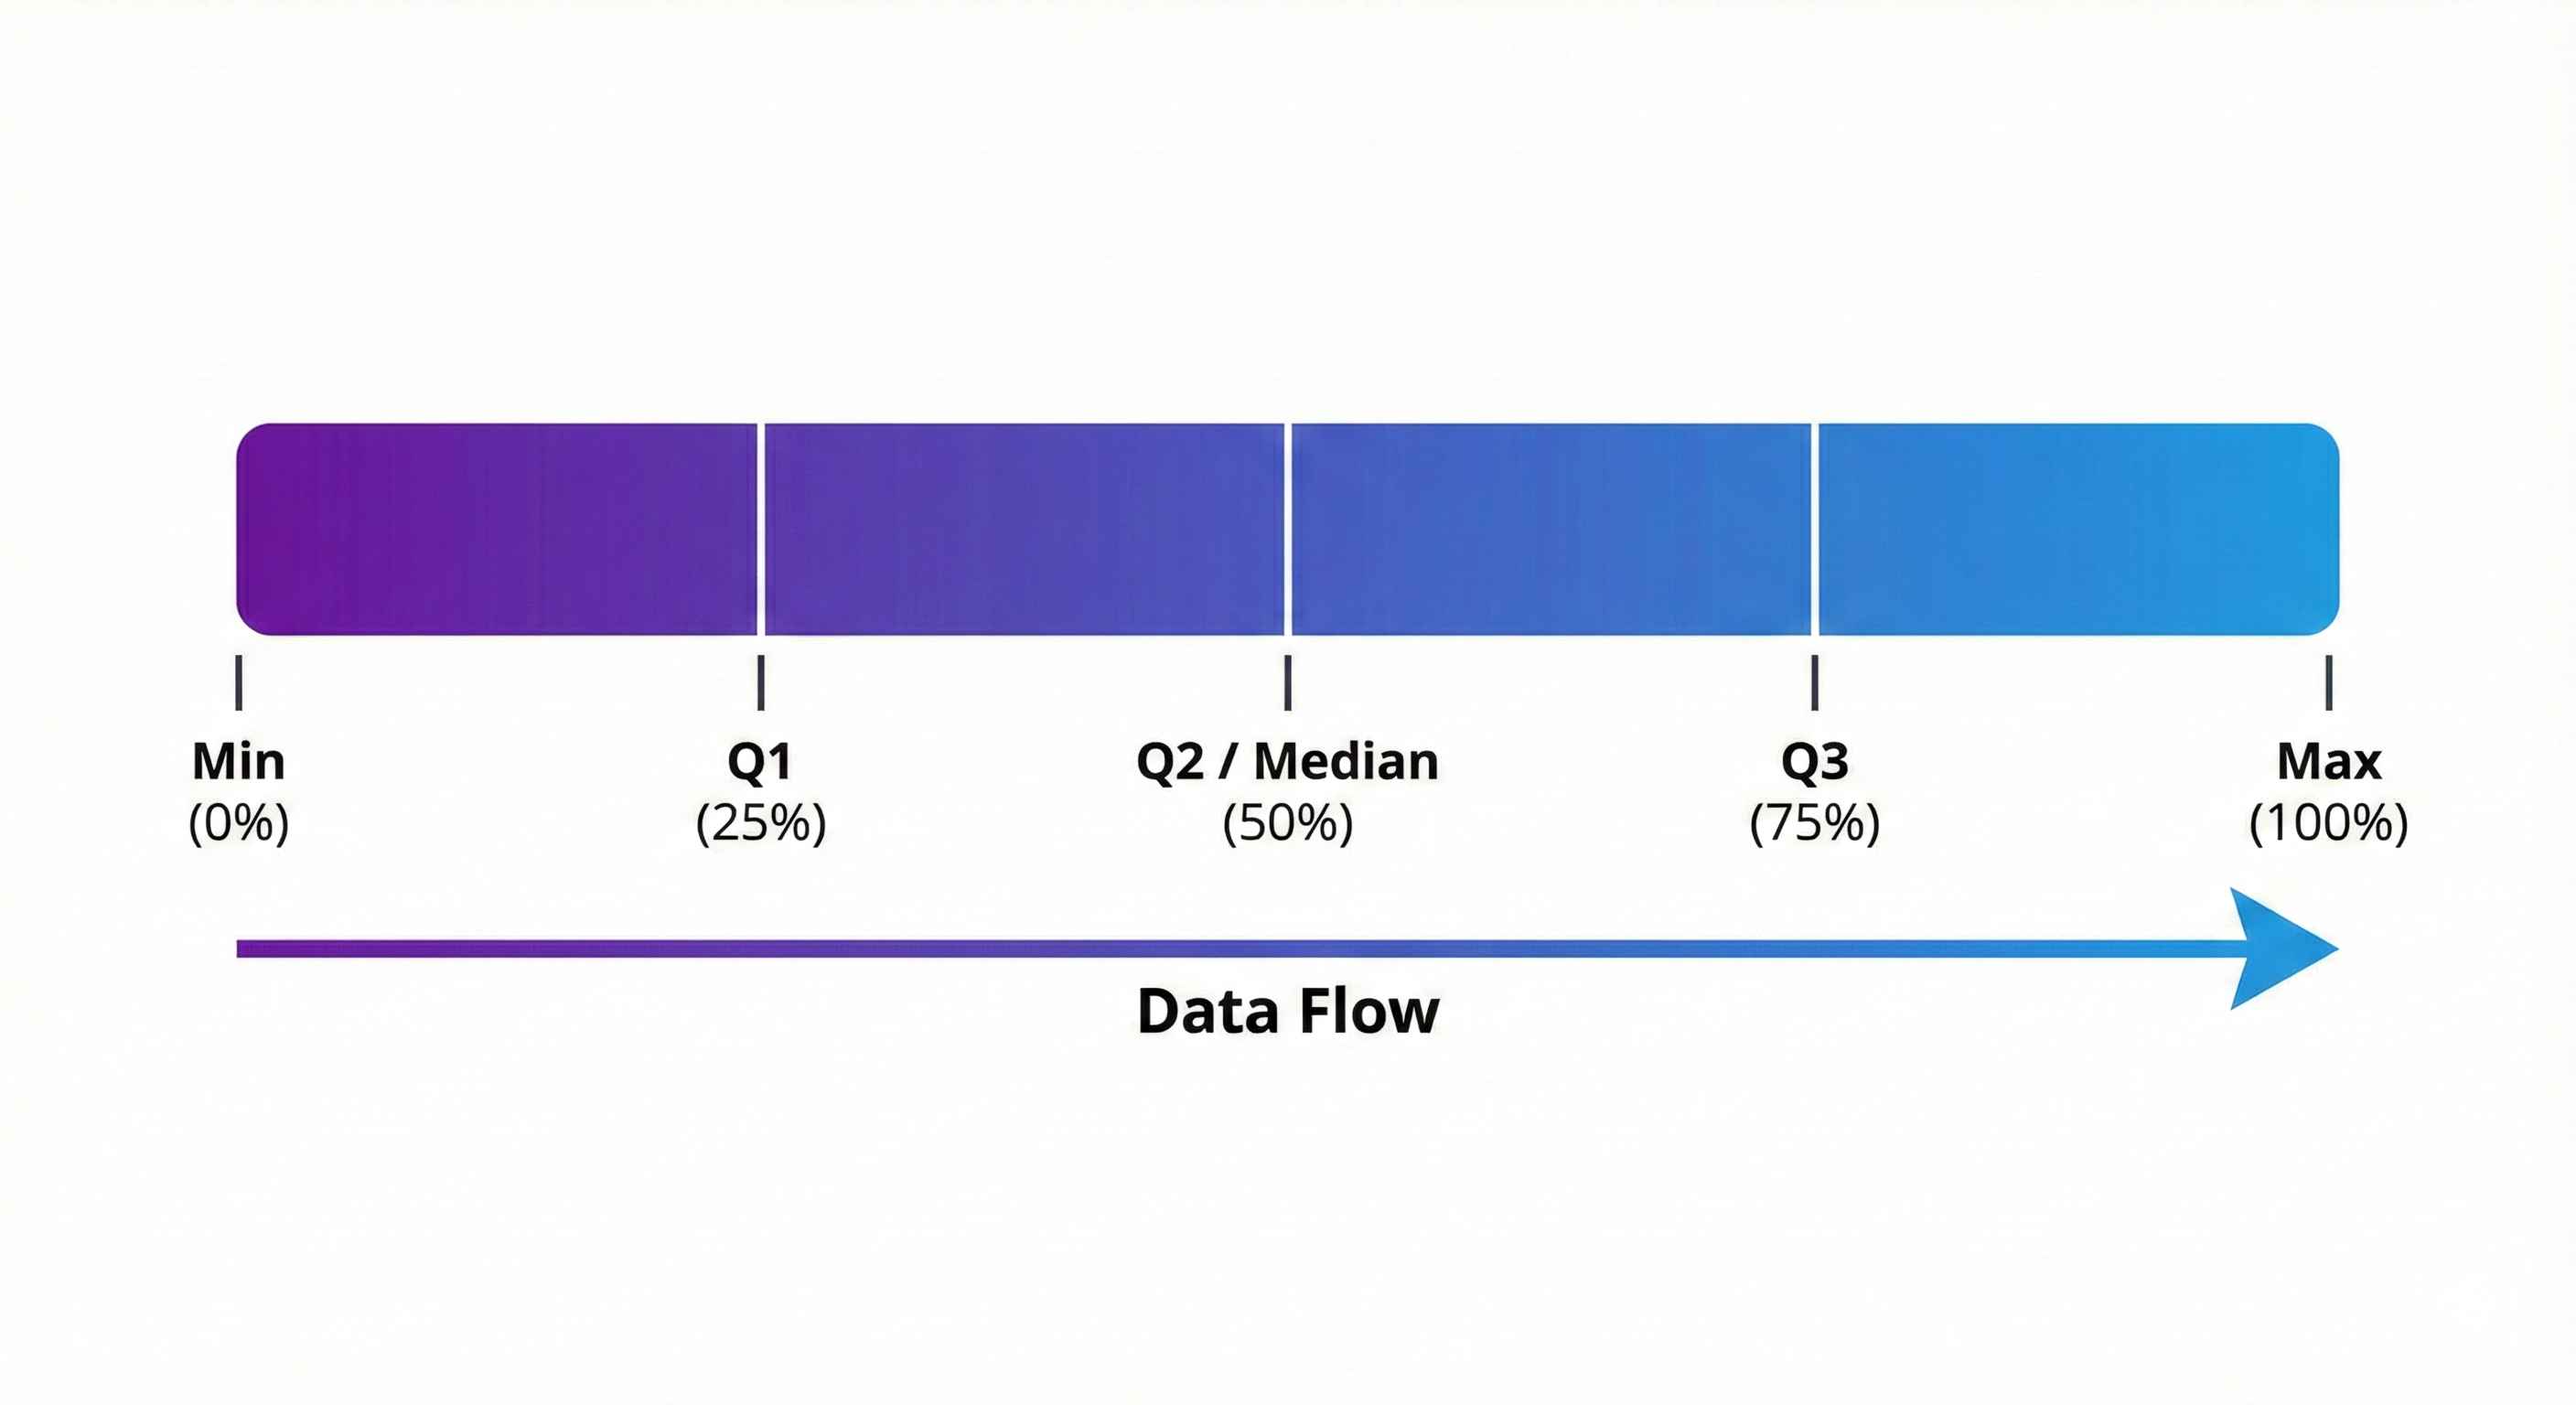
Quartiles = 4 Equal Parts
Quartiles divide your data into 4 equal chunks:
| Quartile | Percentile | Meaning |
|---|---|---|
| Q1 | 25th | 25% of data below this |
| Q2 | 50th | Median (middle value) |
| Q3 | 75th | 75% of data below this |
3 rows
Example: Data: 10, 20, 30, 40, 50, 60, 70, 80
- Q1 = 25 (25% below)
- Q2 = 45 (median)
- Q3 = 65 (75% below)
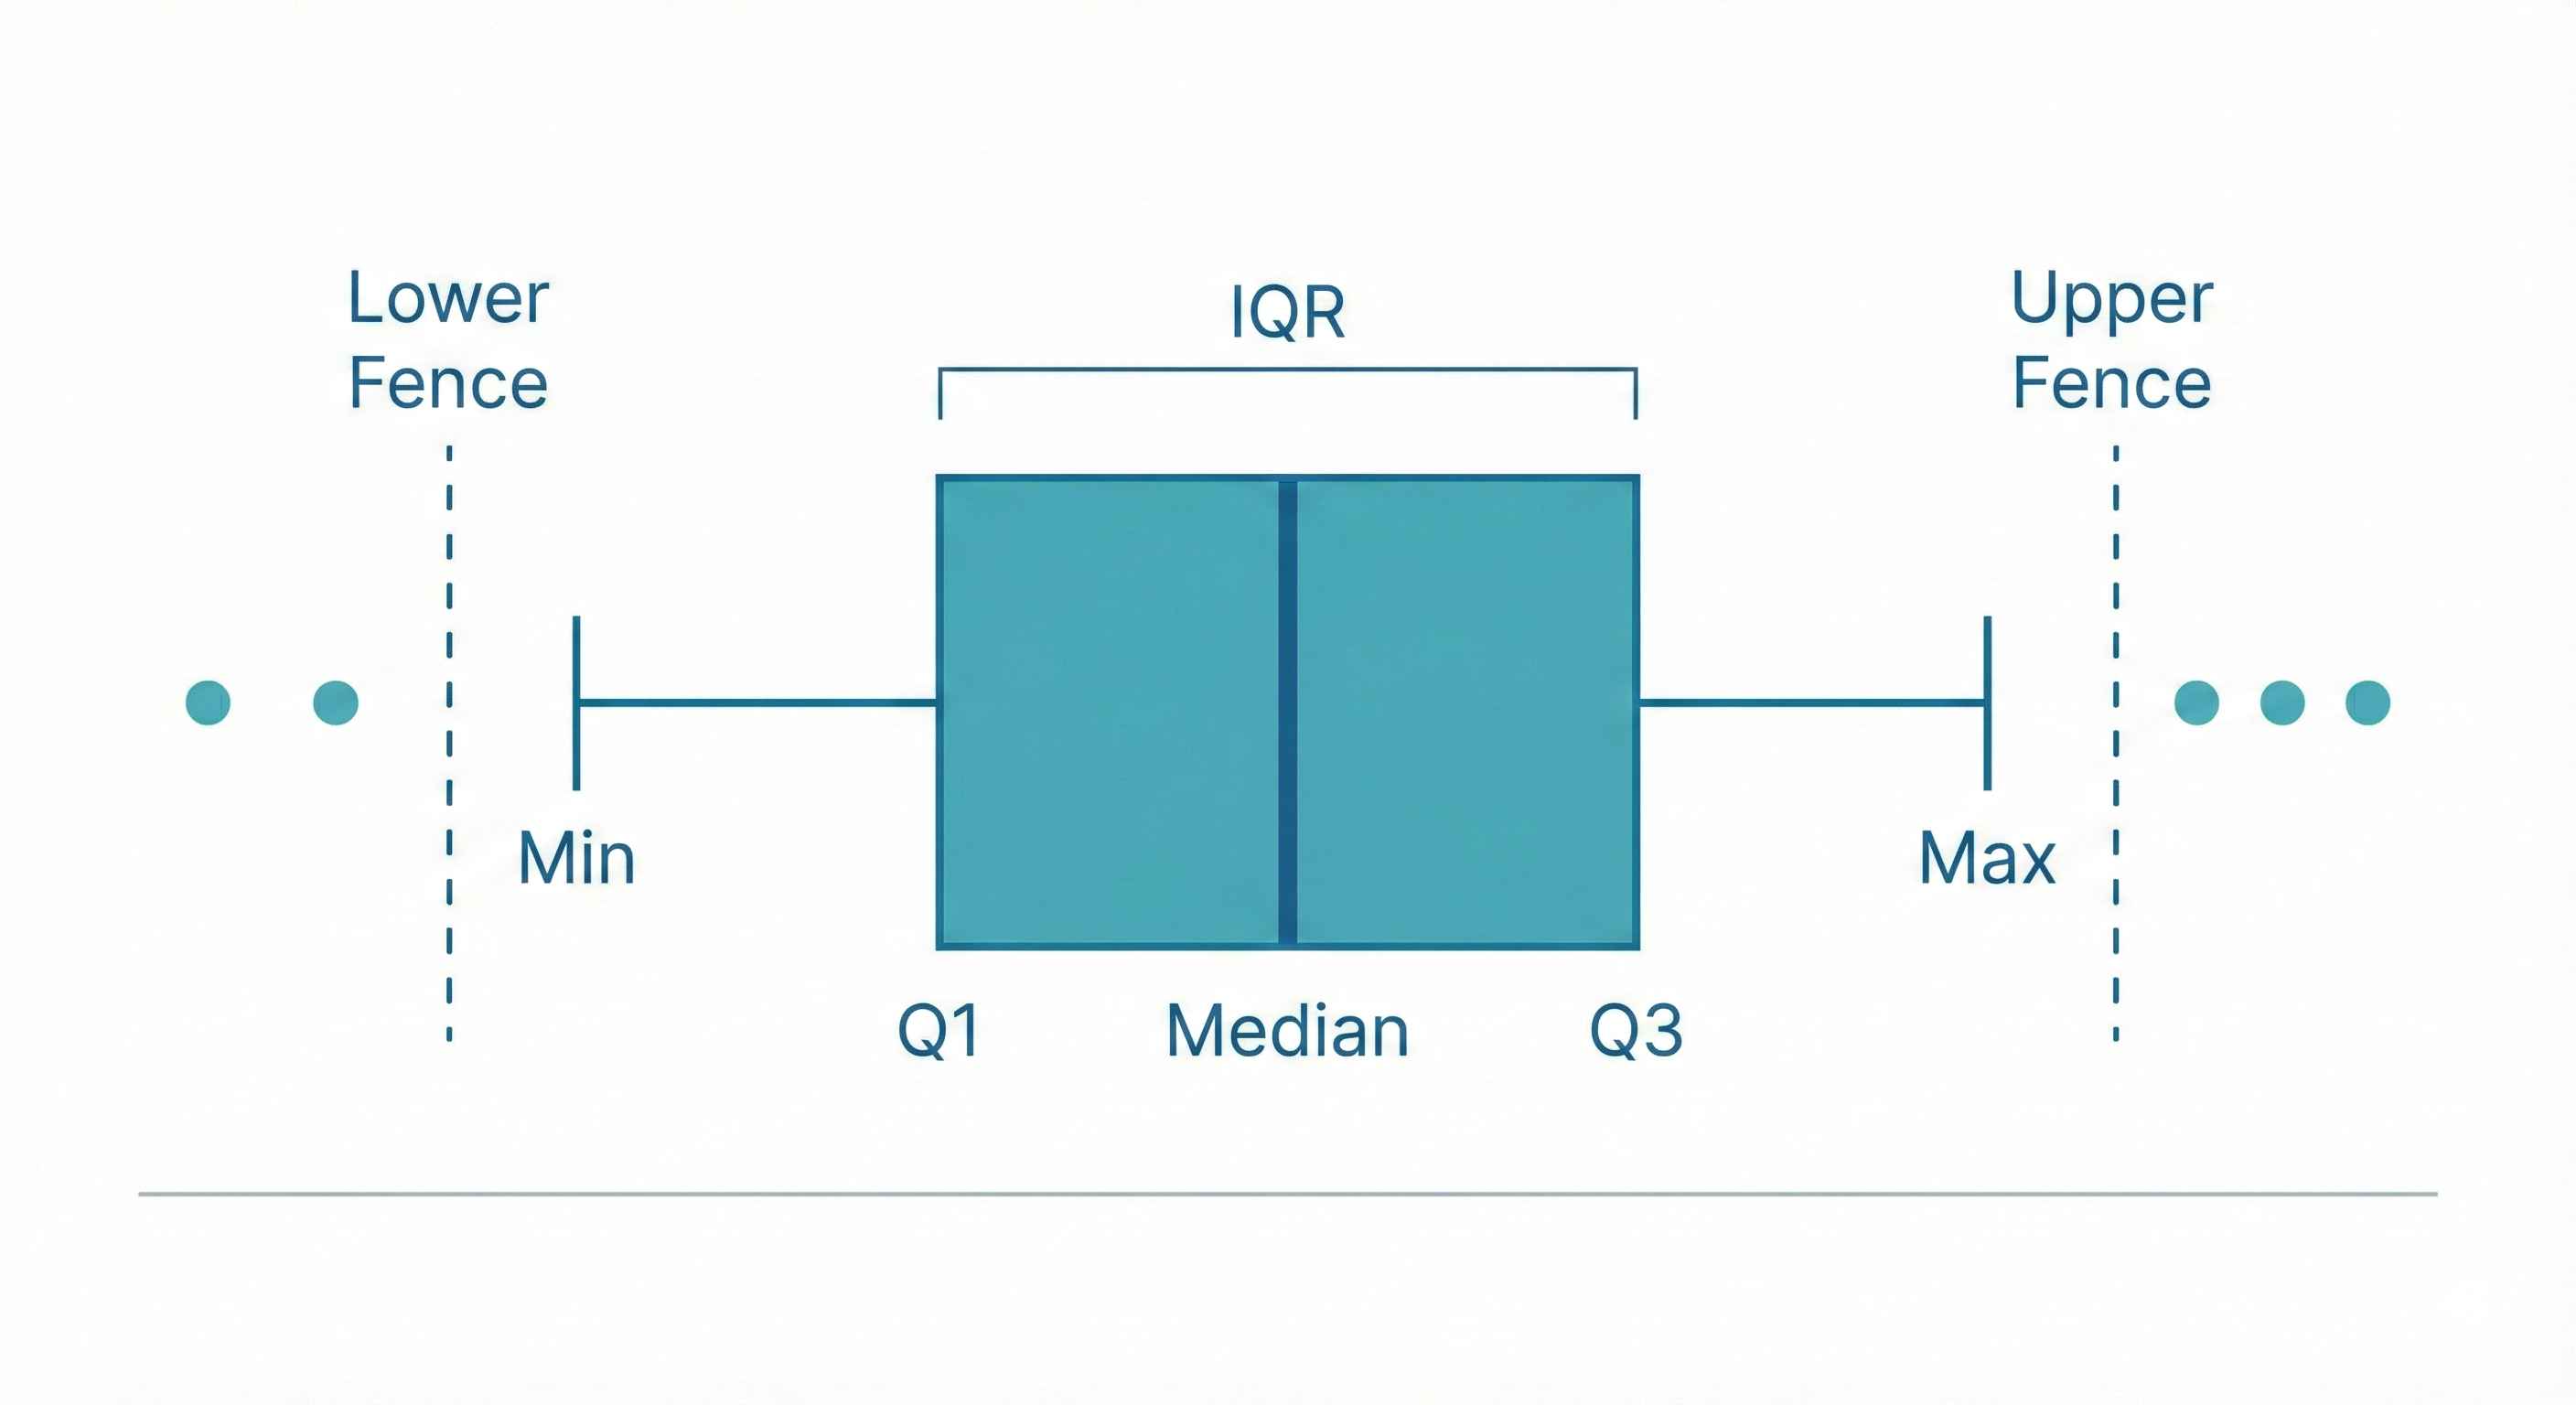
IQR: Finding Outliers
IQR (Interquartile Range) = Q3 - Q1
This is the middle 50% of your data — ignores extreme values!
Outlier Rule:
- Too low: Below Q1 - 1.5 × IQR
- Too high: Above Q3 + 1.5 × IQR
Example: Q1 = 20, Q3 = 80, IQR = 60
- Lower fence = 20 - 90 = -70
- Upper fence = 80 + 90 = 170
Any value < -70 or > 170 is an outlier!
Cheat Sheet
| What | Excel | Python |
|---|---|---|
| Percentile (90th) | =PERCENTILE.INC(A:A, 0.9) | df.quantile(0.9) |
| Q1 (25th) | =QUARTILE.INC(A:A, 1) | df.quantile(0.25) |
| Median (Q2) | =MEDIAN(A:A) | df.median() |
| Q3 (75th) | =QUARTILE.INC(A:A, 3) | df.quantile(0.75) |
4 rows
Quick Practice
Data: 10, 20, 30, 40, 50, 60, 70, 80, 90
- Q1 = 25
- Q2 = 50 (median)
- Q3 = 75
- IQR = 75 - 25 = 50
Tip: Percentiles are used everywhere — job salaries, test scores, performance metrics. Master them!