Chi-Square Tests
Test relationships between categorical variables
What You'll Learn
- Chi-square test of independence
- Goodness-of-fit test
- Expected vs observed frequencies
- Applications
Chi-Square Test
For: Categorical data
Two types:
- Goodness of fit: One variable
- Test of independence: Two variables
Test of Independence
Question: Are two categorical variables related?
Example: Is gender related to product preference?
Data format: Contingency table (cross-tab)
Steps:
- Calculate expected frequencies
- Compare to observed
- Calculate chi-square statistic
- Check p-value
Excel: =CHISQ.TEST(observed_range, expected_range) Python: scipy.stats.chi2_contingency(table)
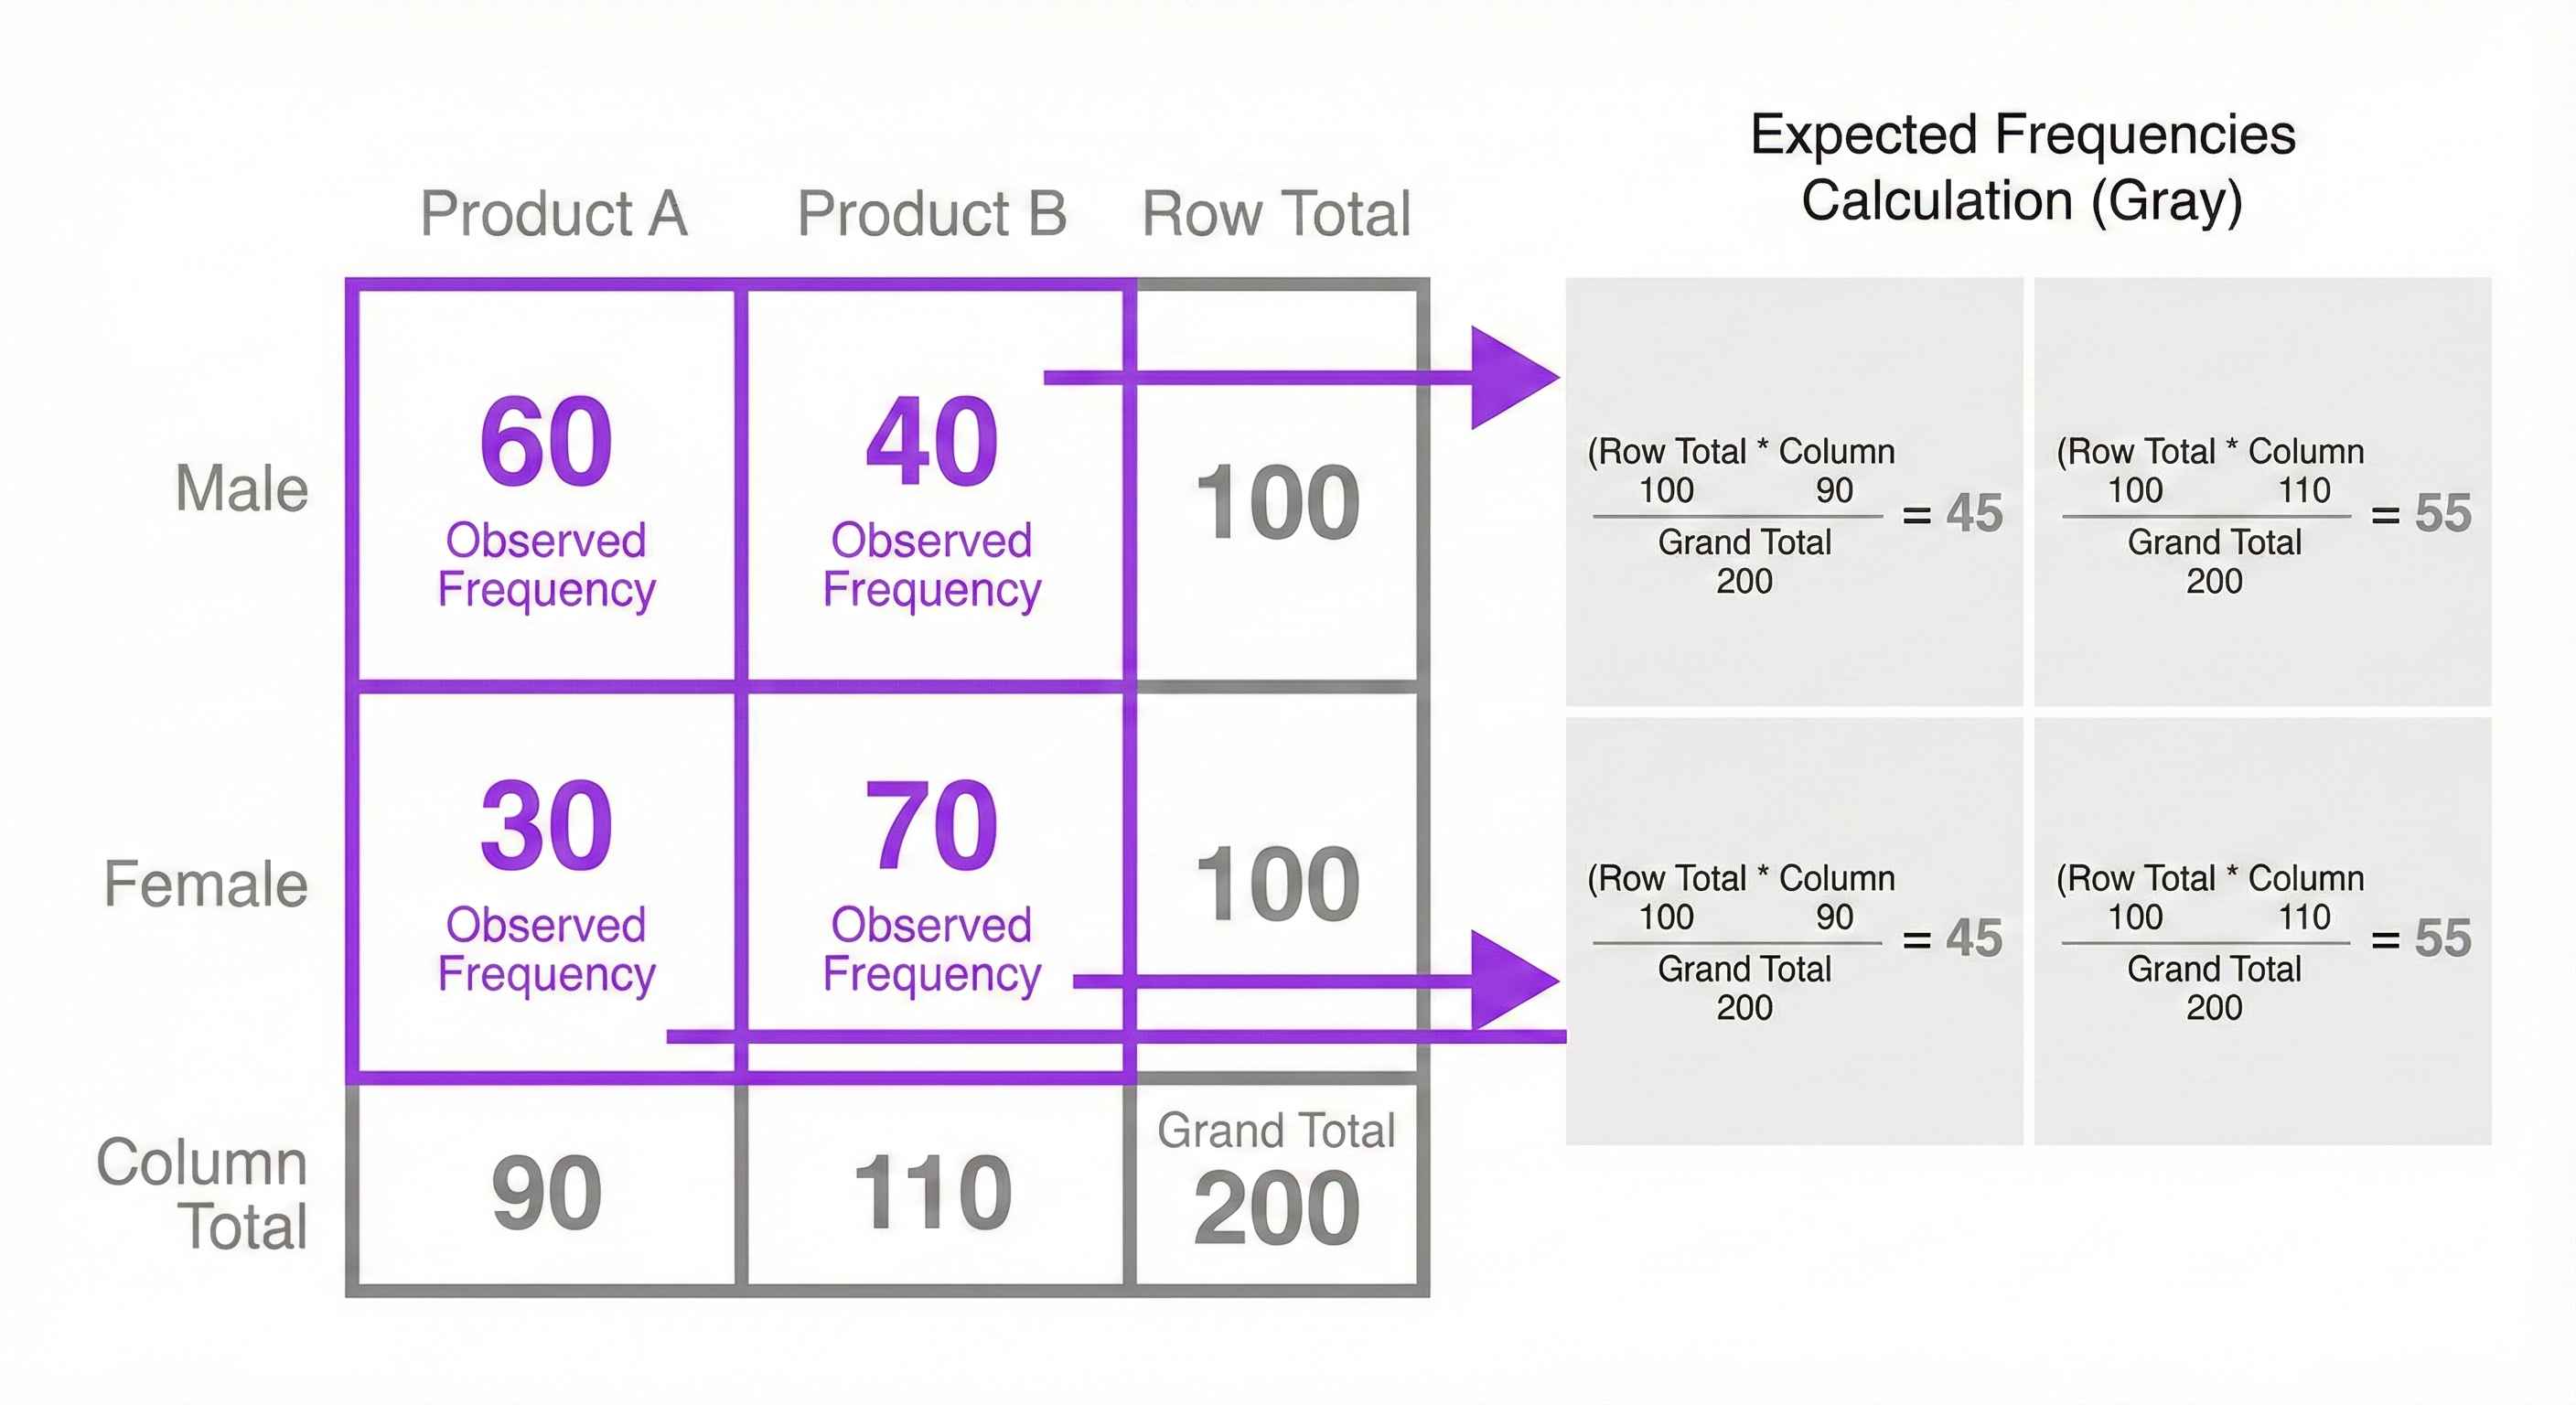
Expected Frequencies
Formula: Expected = (Row Total × Column Total) / Grand Total
Example: Men who prefer Product A: Expected = (Total Men × Total Product A) / Total People
Chi-Square Statistic
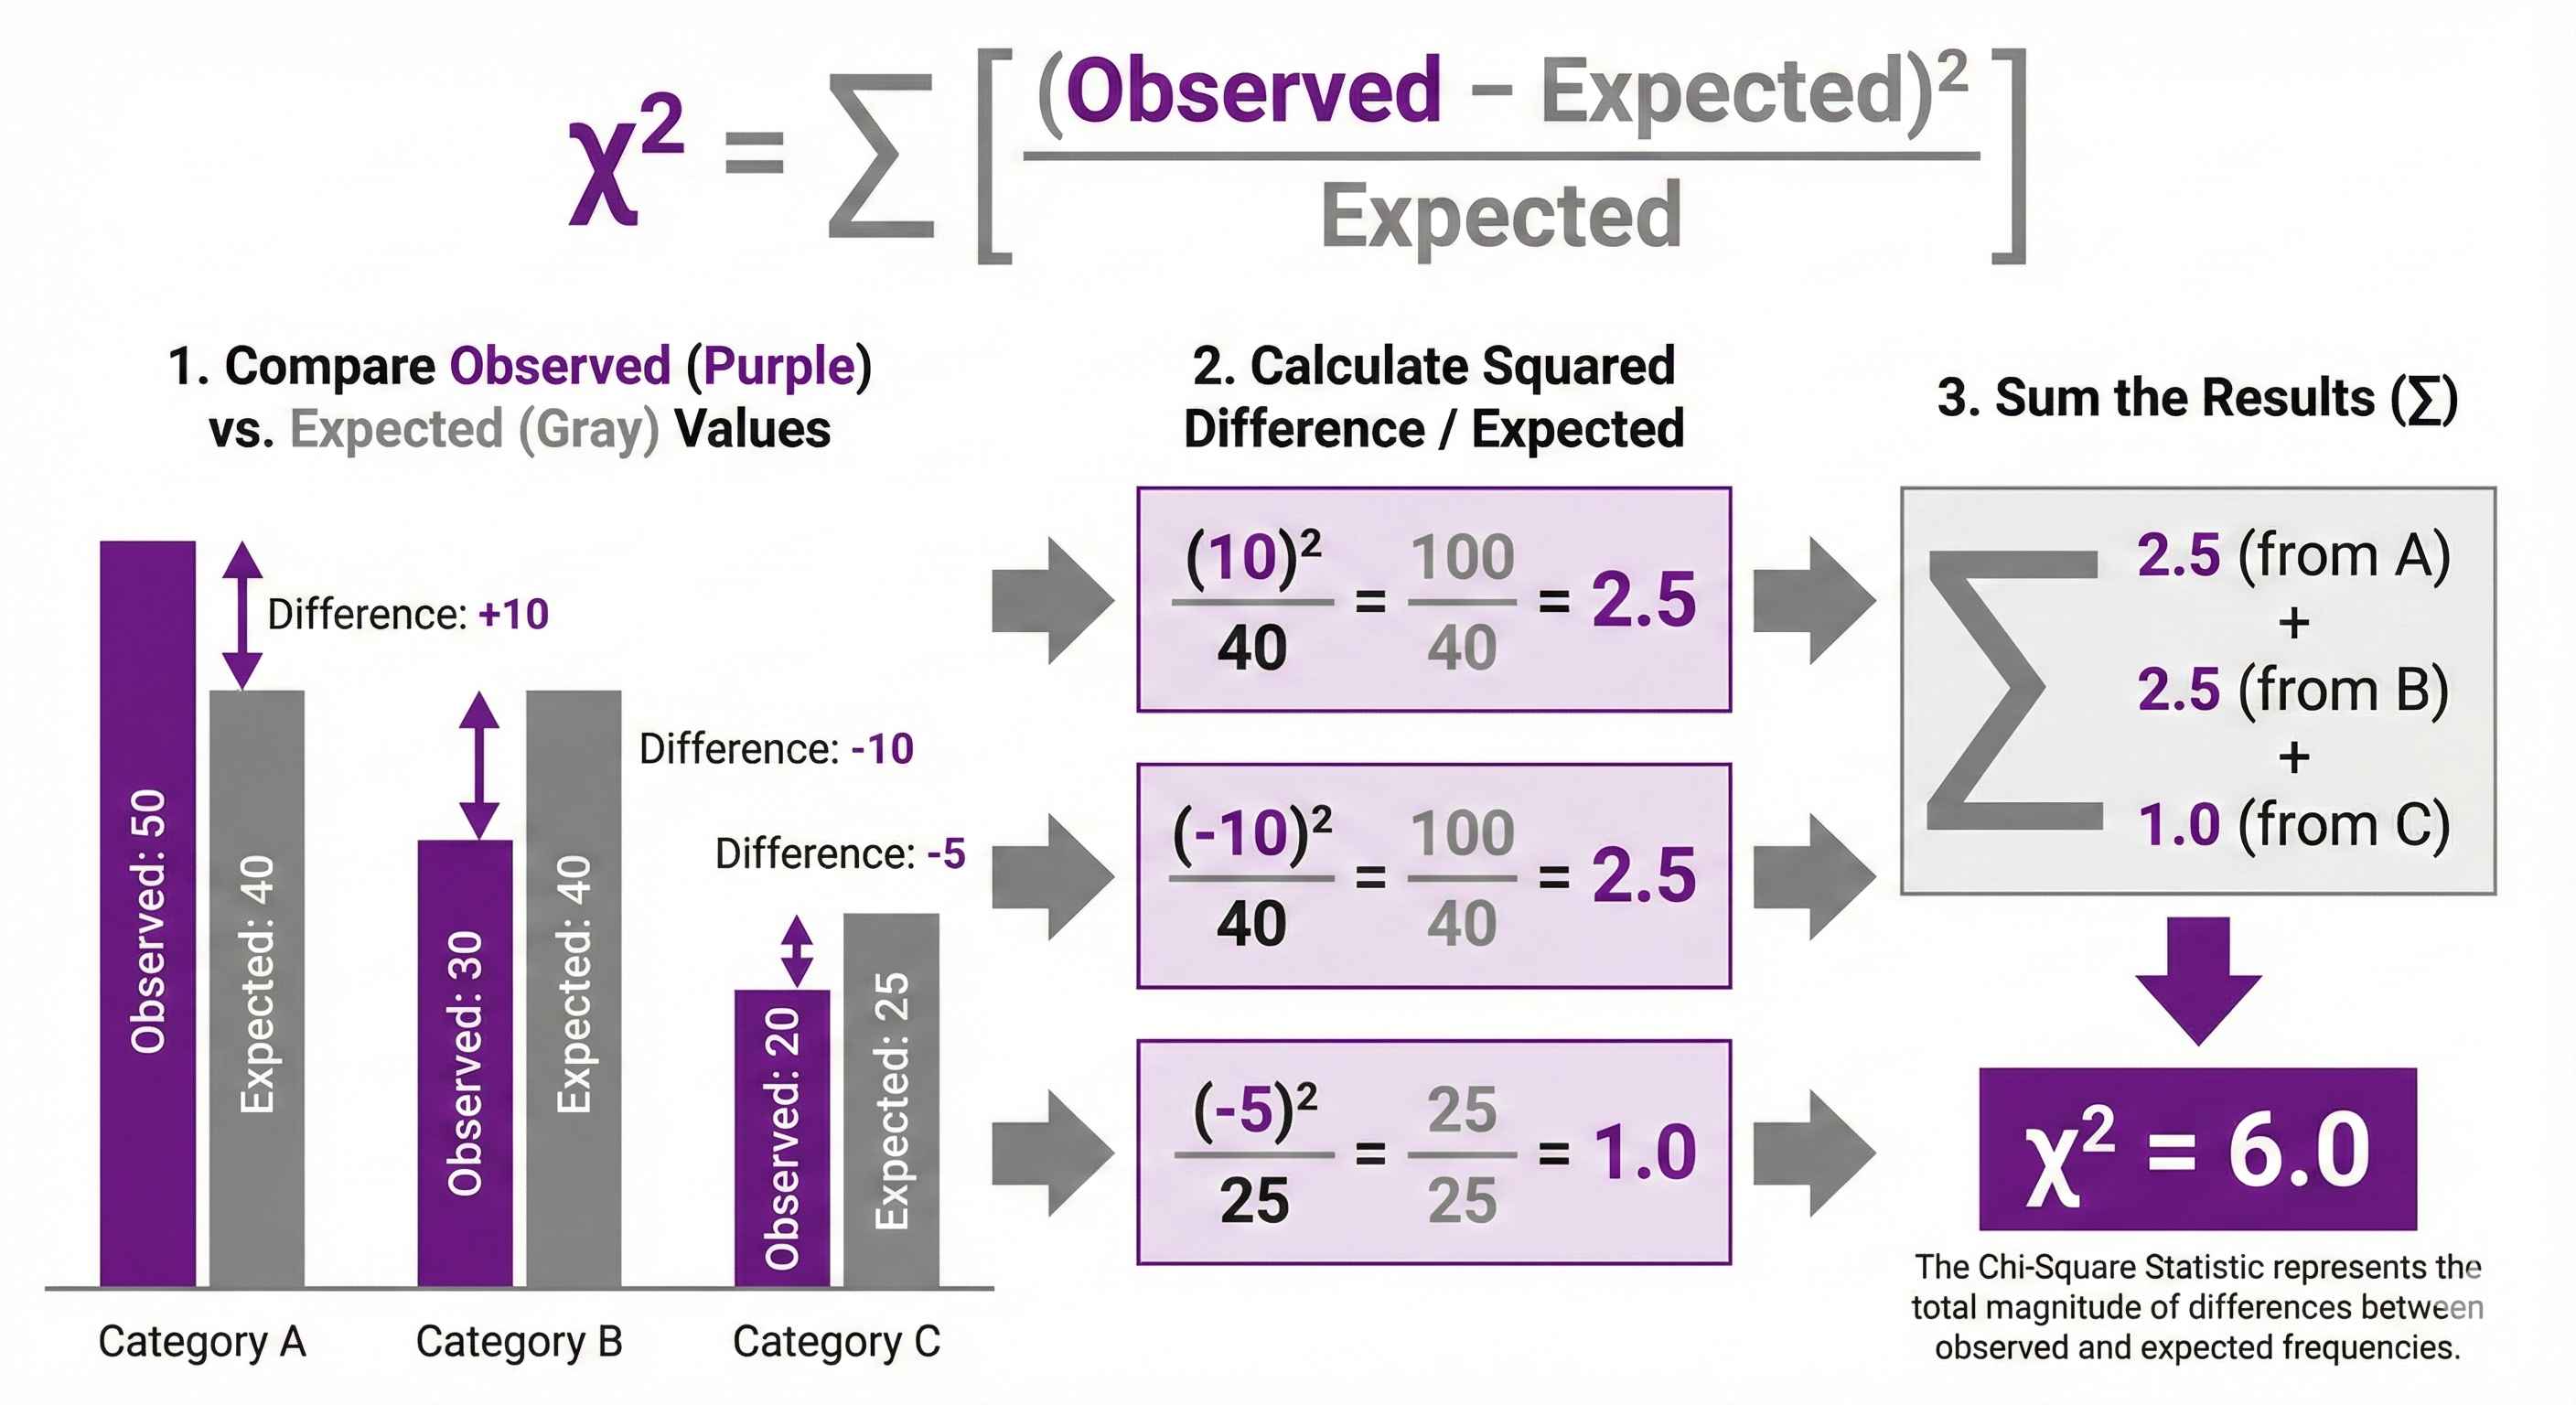
Formula: χ² = Σ [(Observed - Expected)² / Expected]
Large χ²: Big difference between observed and expected = Variables are related!
P-Value Interpretation
p < 0.05: Variables ARE related (reject independence)
p ≥ 0.05: No evidence of relationship
Goodness of Fit
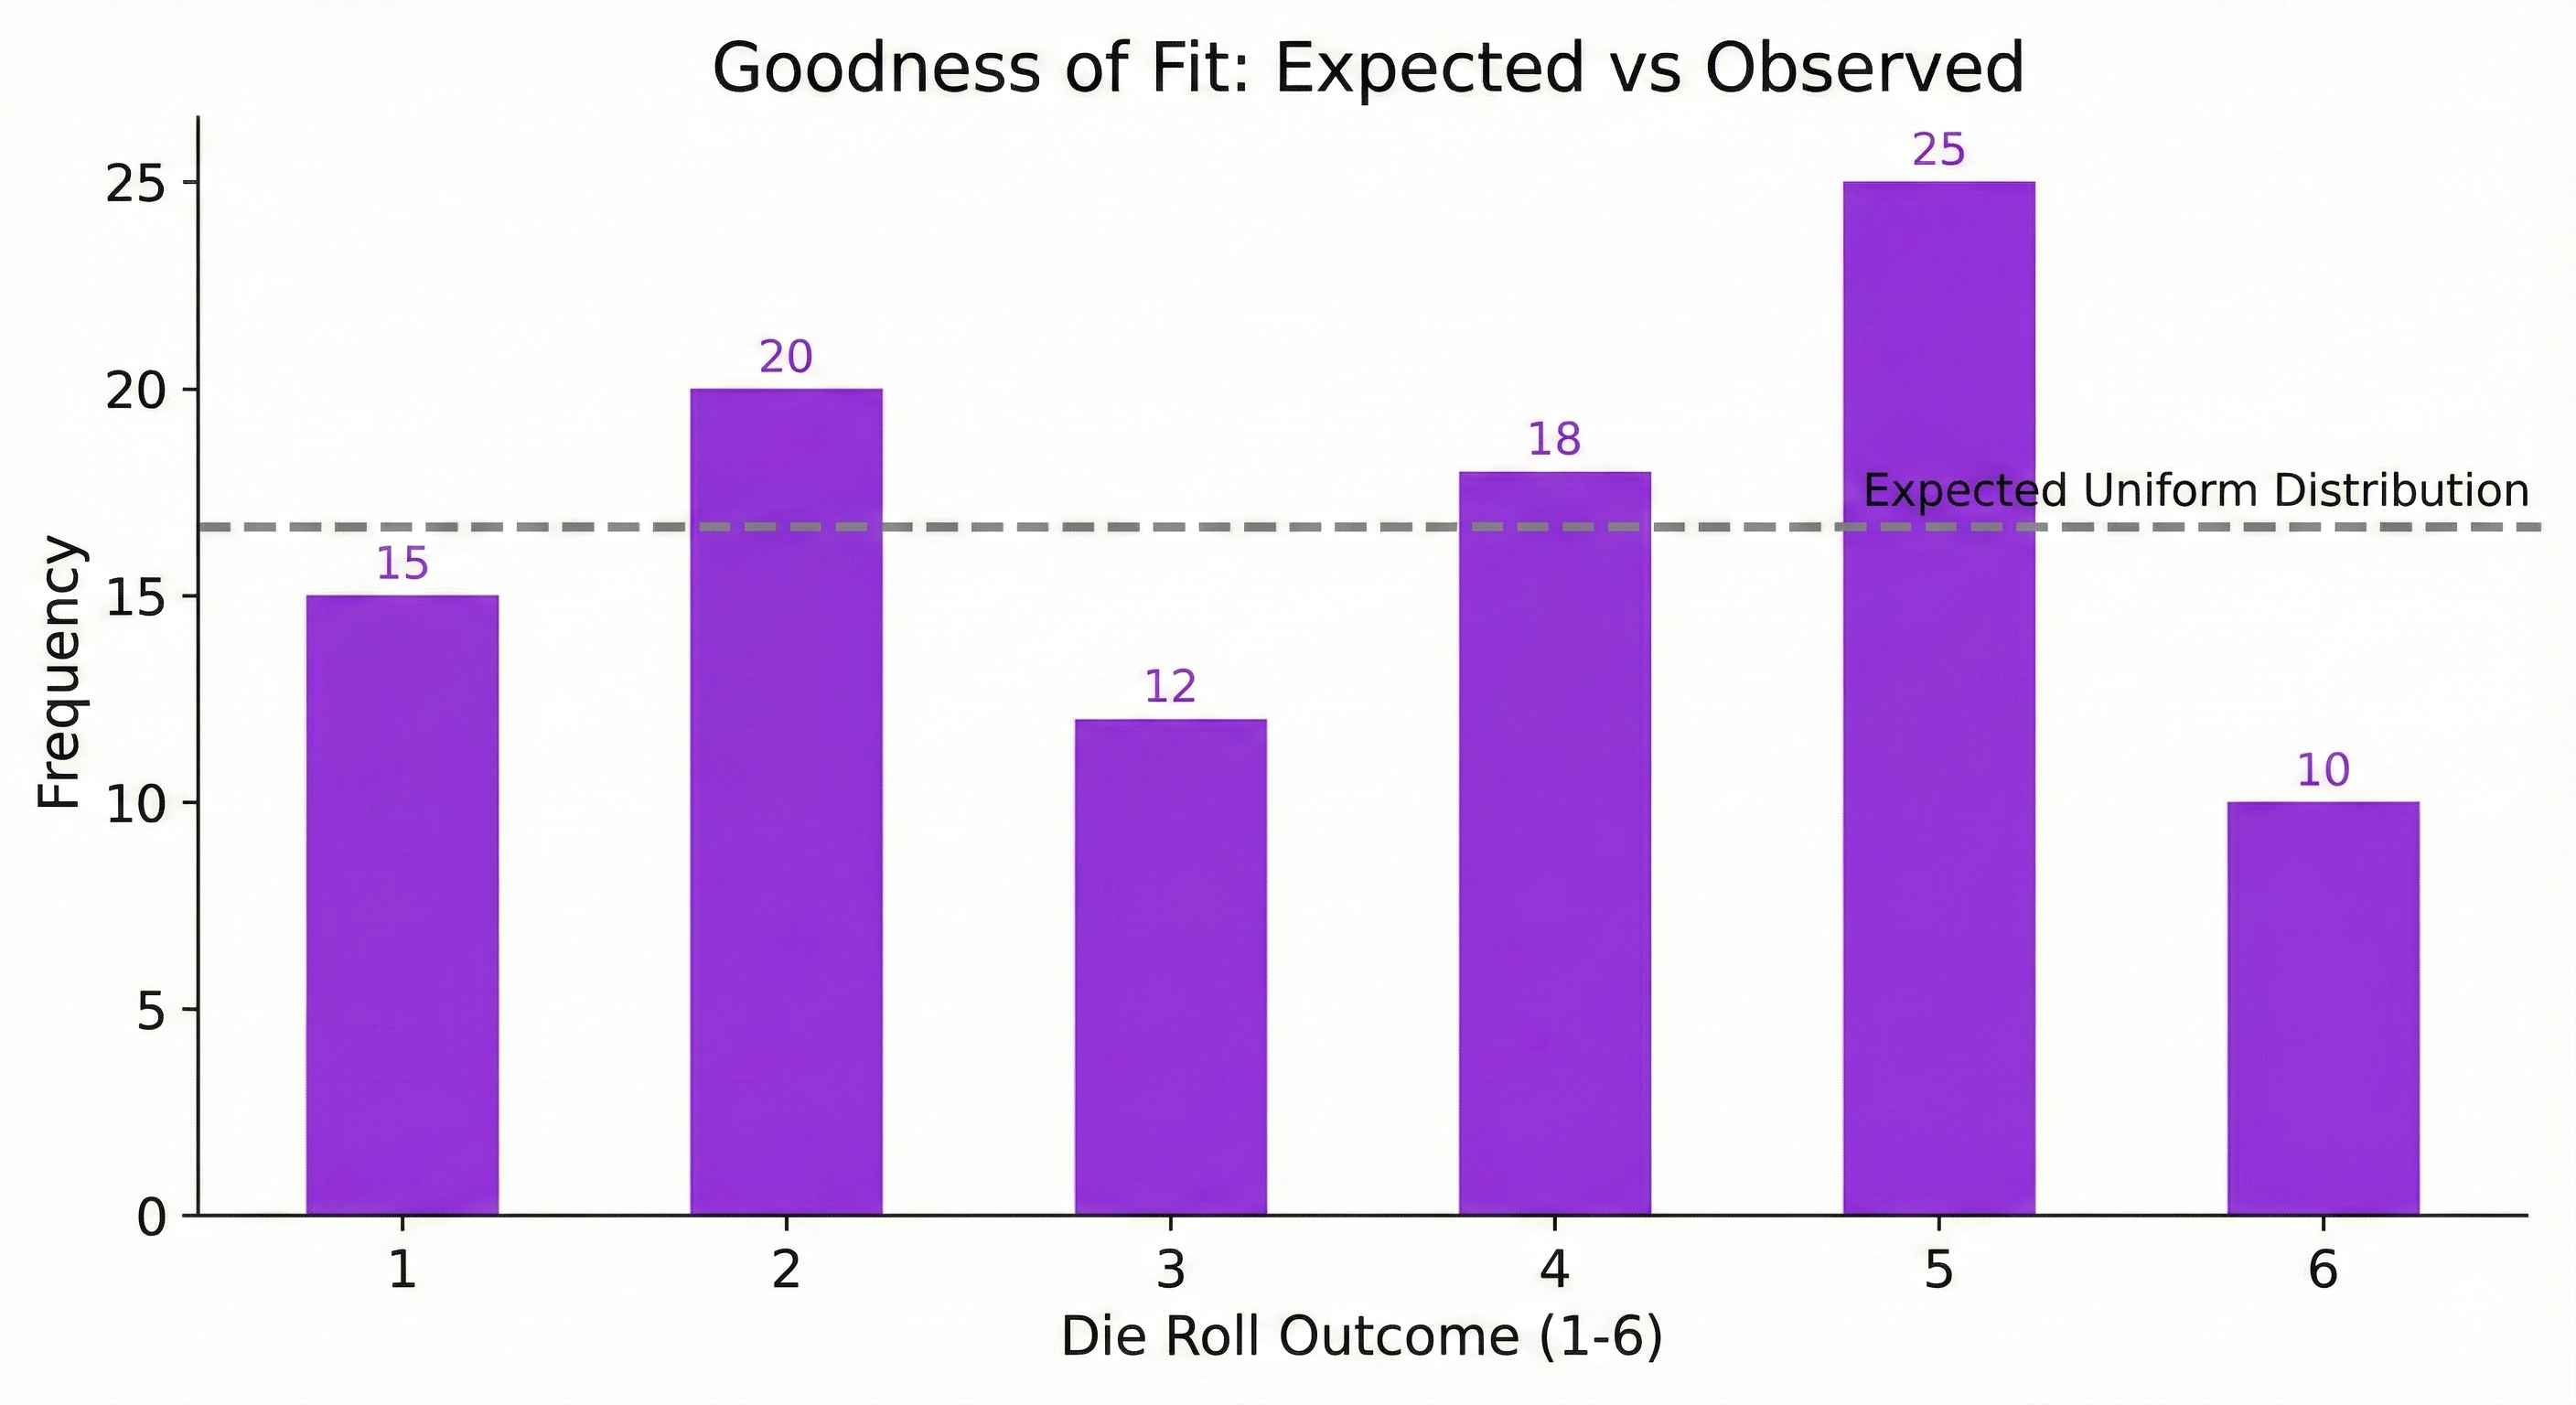
Question: Does data match expected distribution?
Example: Do die rolls follow uniform distribution?
Use: Test if sample matches theoretical distribution
Assumptions
Requirements:
- Expected frequency ≥ 5 in each cell
- Independent observations
- Random sample
Practice Exercise
Survey: Men: Like=40, Dislike=10 Women: Like=20, Dislike=30
Test if gender and preference are independent.
Next Steps
Learn about Type I & II Errors!
Tip: Chi-square for categorical data, t-test for continuous!